

Question: Demand for devils food whipped-cream layer cake at a local pastry shop can be approximated using a Poisson distribution with a mean of 5.4 per
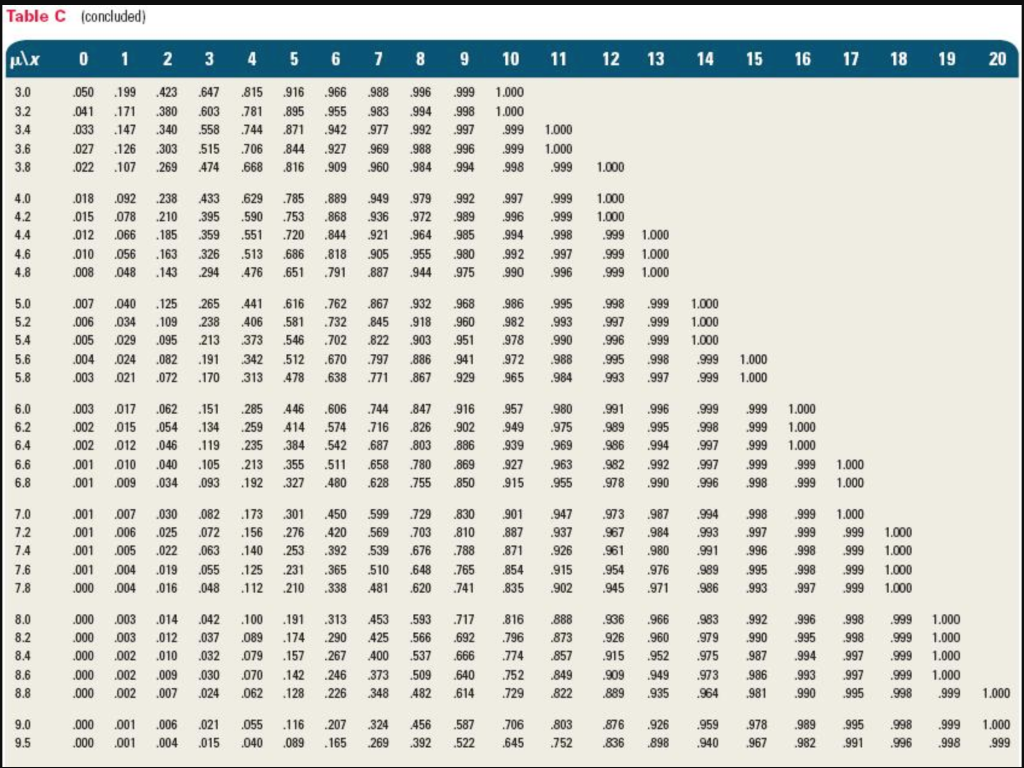
Demand for devils food whipped-cream layer cake at a local pastry shop can be approximated using a Poisson distribution with a mean of 5.4 per day. The manager estimates it costs $22 to prepare each cake. Fresh cakes sell for $25. Day-old cakes sell for $22 each. Use table C.
1. Assume one-half of the day-old cakes are sold, and the rest thrown out. What service level is achieved in this situation?
2. What stocking level is appropriate to achieve this service level?
Step by Step Solution
There are 3 Steps involved in it
1 Expert Approved Answer
Step: 1 Unlock

Question Has Been Solved by an Expert!
Get step-by-step solutions from verified subject matter experts
Step: 2 Unlock
Step: 3 Unlock