

Question: Demand Weekly Forecast per week Forecast Error 1 60 n/a n/a n/a 2 68 3 80 4 76 76 5 90 6 100 7
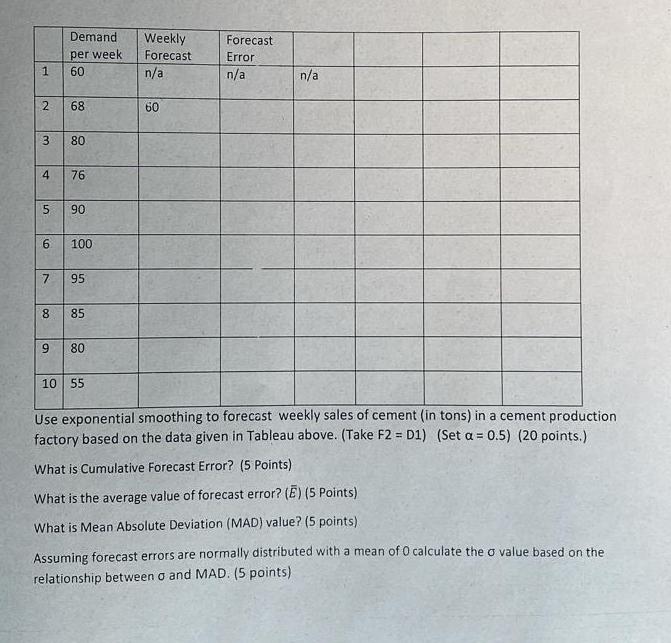
Demand Weekly Forecast per week Forecast Error 1 60 n/a n/a n/a 2 68 3 80 4 76 76 5 90 6 100 7 95 80 6 85 60 00 80 10 55 Use exponential smoothing to forecast weekly sales of cement (in tons) in a cement production factory based on the data given in Tableau above. (Take F2 = D1) (Set a = 0.5) (20 points.) What is Cumulative Forecast Error? (5 Points) What is the average value of forecast error? (E) (5 Points) What is Mean Absolute Deviation (MAD) value? (5 points) Assuming forecast errors are normally distributed with a mean of 0 calculate the o value based on the relationship between and MAD. (5 points)
Step by Step Solution
There are 3 Steps involved in it

Get step-by-step solutions from verified subject matter experts