

Question: Demonstrate and Explain: Clearly and thoroughly explain your answers to these questions based on the work you did with your group on labs this week.
Demonstrate and Explain: Clearly and thoroughly explain your answers to these questions based on the work you did with your group on labs this week. These questions refer to Lab 7: Exploring Derivatives of Exponential Functions. (a) (Part 2 ) Show the graph of the function m(x) = .5(3x) and the derivative function m?(x). What is the formula for d/dx (.5(3x))? How can you confirm this using Desmos? (b) (Part 3 ) Explain the steps you used to find the function P (x) to model the price of gas in the first 6 months of 2022. What does your function predict for April 2022 (month 3)? How does this compare to the source data? (c) (Part 4b) Explain how to find a formula for P ?(x), evaluate this derivative for April, and explain in words what this represents.
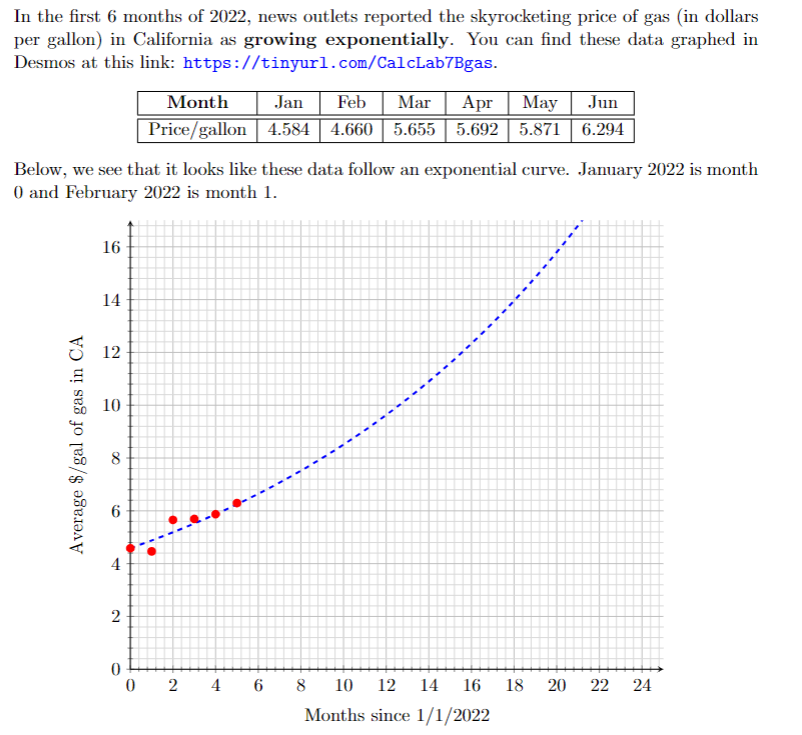
For part (b) and (c), the graph and the table is in the image below-

In the first 6 months of 2022, news outlets reported the skyrocketing price of gas (in dollars per gallon) in California as growing exponentially. You can find these data graphed in Desmos at this link: https://tinyurl. com/CalcLab7Bgas. Month Jan Feb Mar Apr May Jun Price/gallon |4.584 4.660 5.655 5.692 5.871 6.294 Below, we see that it looks like these data follow an exponential curve. January 2022 is month 0 and February 2022 is month 1. 16 14 12 10 Average $/gal of gas in CA 8 6 4 0 0 2 4 6 8 10 12 14 16 18 20 22 24 Months since 1/1/2022
Step by Step Solution
There are 3 Steps involved in it

Get step-by-step solutions from verified subject matter experts