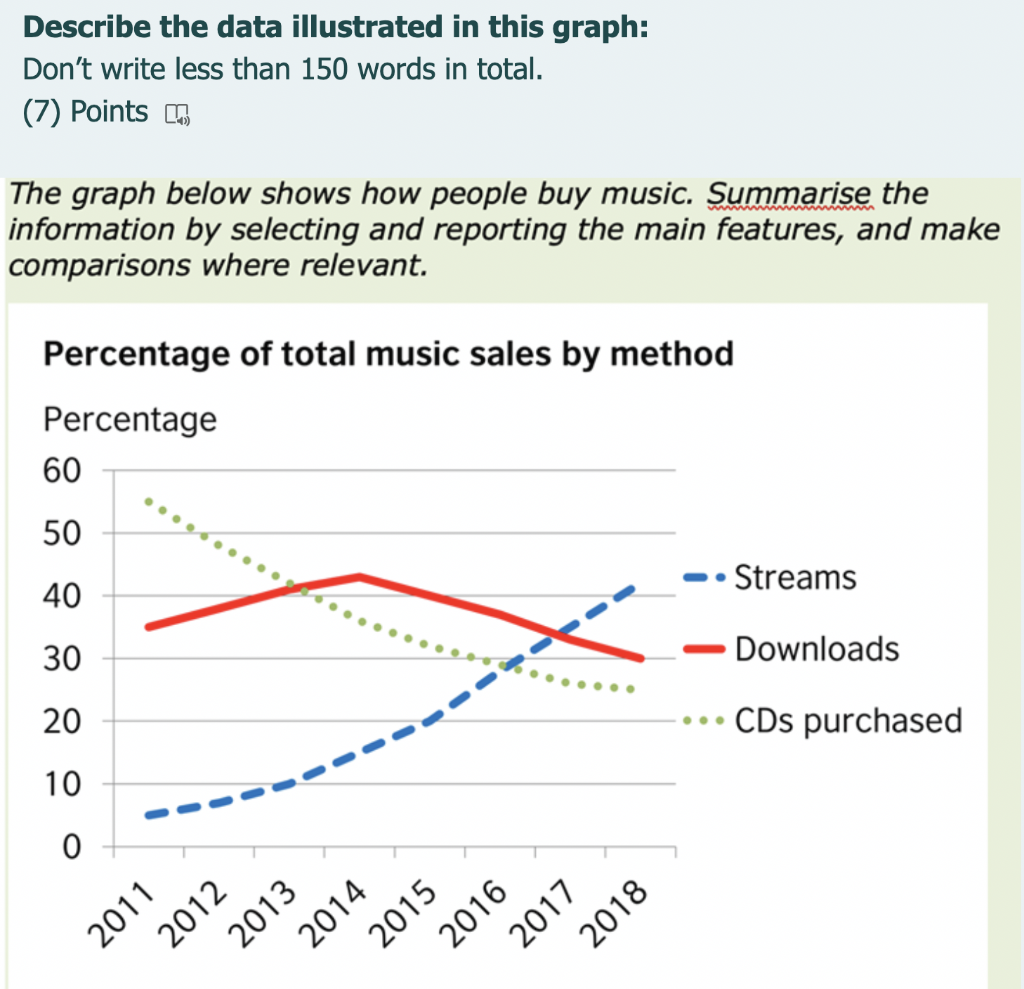
Question: Describe the data illustrated in this graph: Don't write less than 150 words in total. (7) Points (1) The graph below shows how people buy

Describe the data illustrated in this graph:

Describe the data illustrated in this graph: Don't write less than 150 words in total. (7) Points (1) The graph below shows how people buy music. Summarise the information by selecting and reporting the main features, and make comparisons where relevant. Percentage of total music sales by method Percentage 60 50 Streams 40 30 Downloads 20 ... CDs purchased 10 0 i 2013 2012 2018 2017 2011 2014 2016

Step by Step Solution

There are 3 Steps involved in it

1 Expert Approved Answer
Step: 1 Unlock blur-text-image
Question Has Been Solved by an Expert!

Get step-by-step solutions from verified subject matter experts

Step: 2 Unlock
Step: 3 Unlock

Students Have Also Explored These Related General Management Questions!