

Question: Describe what is misleading about the graph below and how it could be 2 points corrected. * Monthly Sales Data 1800 1700 Units Sold 1600
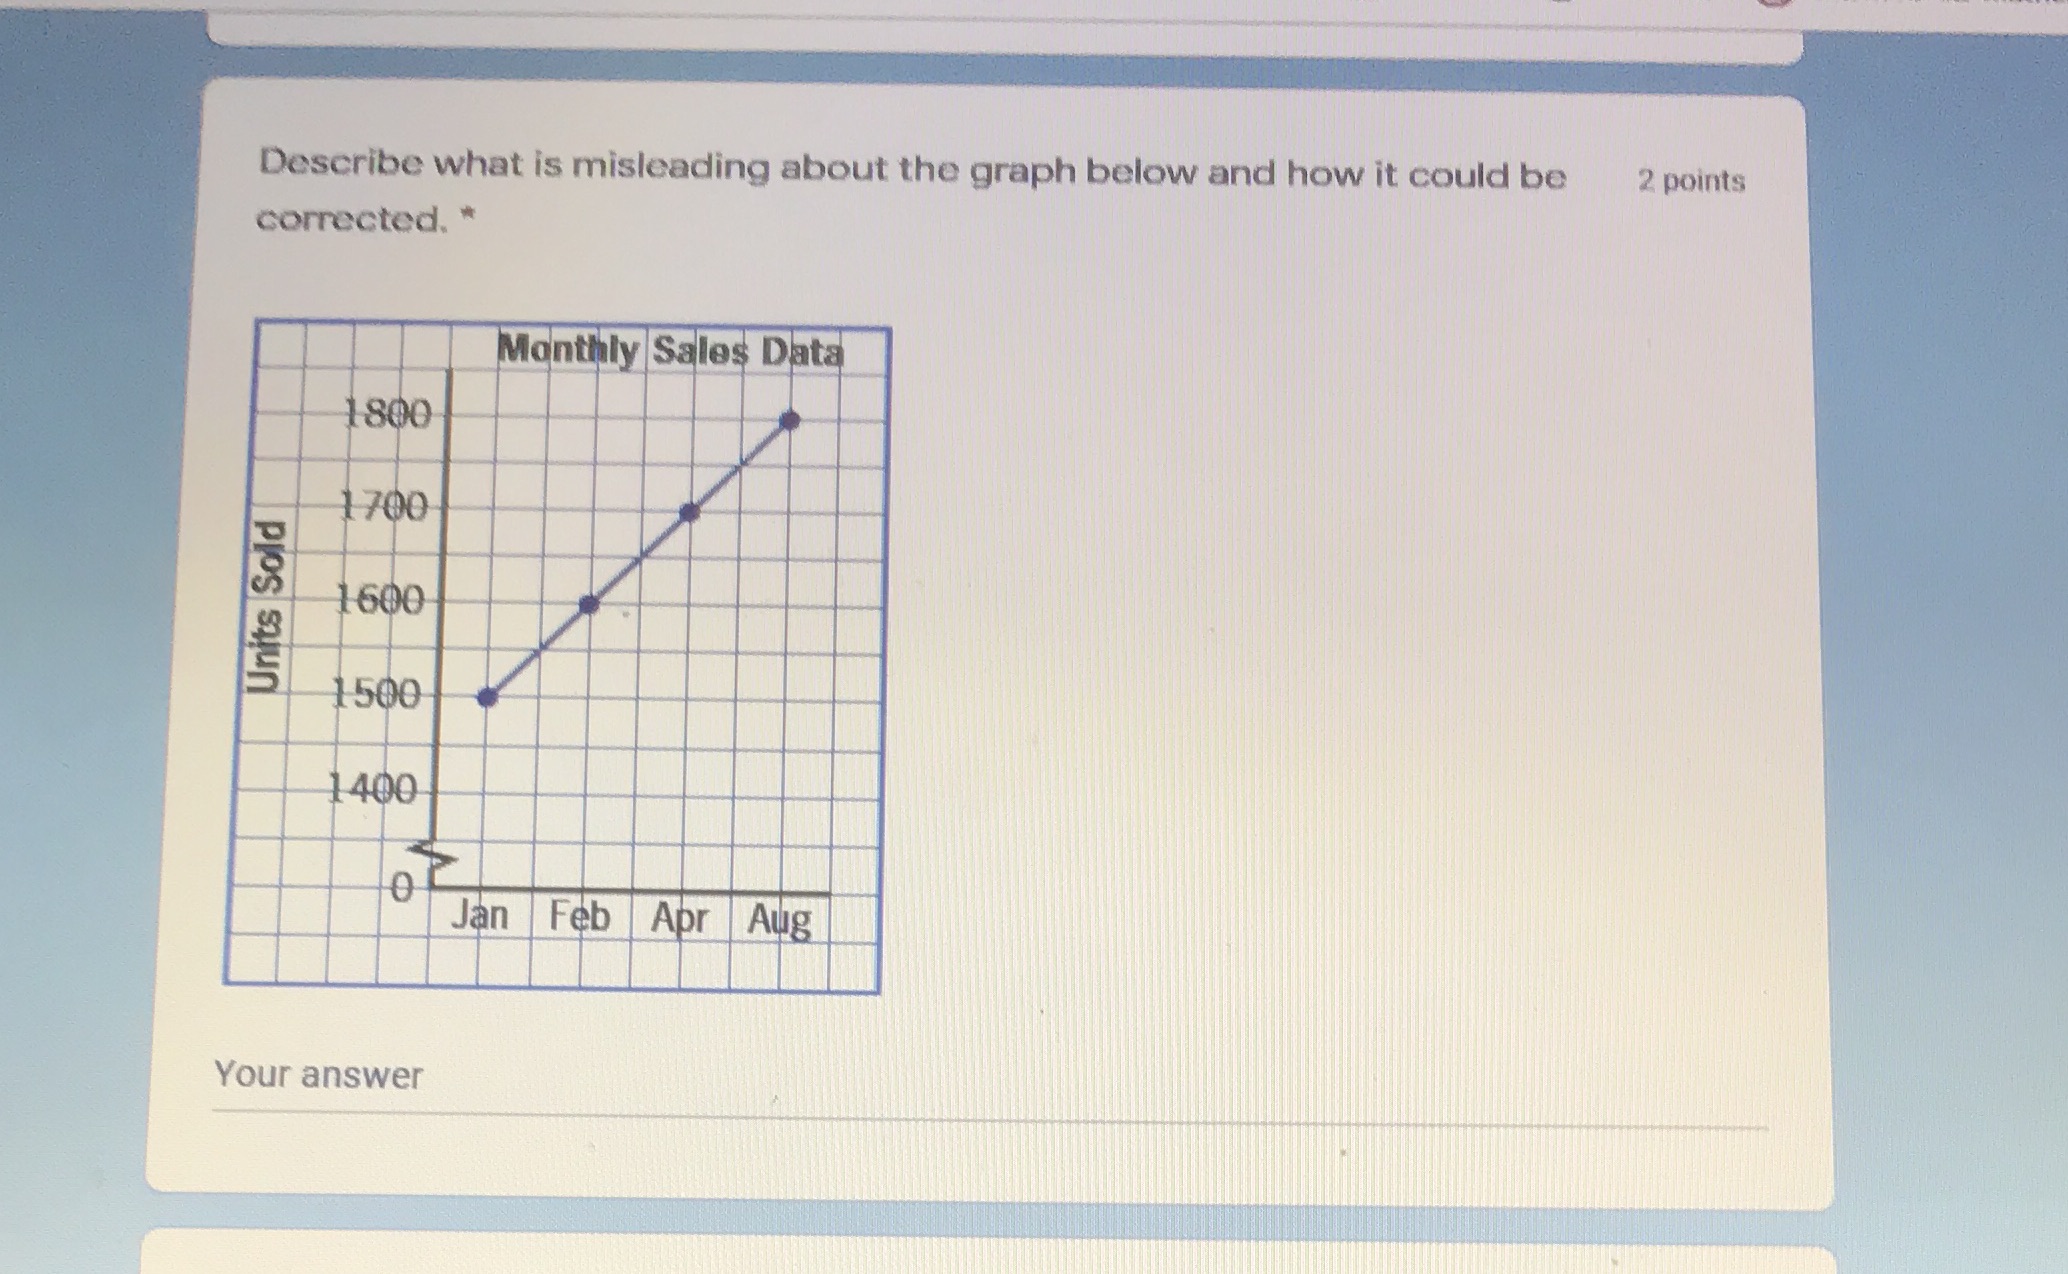
Describe what is misleading about the graph below and how it could be 2 points corrected. * Monthly Sales Data 1800 1700 Units Sold 1600 1500 1400 OC Jan Feb Apr Aug Your
Step by Step Solution
There are 3 Steps involved in it
1 Expert Approved Answer
Step: 1 Unlock

Question Has Been Solved by an Expert!
Get step-by-step solutions from verified subject matter experts
Step: 2 Unlock
Step: 3 Unlock