

Question: Description for PYTHON This file will: Download 1 year COST (costco) stock data from finance.yahoo.com. First go to 'finance.yahoo.com', search COST on top, click historical
 Description for PYTHON
This file will:
Download 1 year COST (costco) stock data from finance.yahoo.com. First go to 'finance.yahoo.com', search COST on top, click "historical data", choose "1 year" and "daily", click "apply" then click "Download". Now you have the 1 year stock in csv format. Copy or move/drag this csv file to the same directory where you write and execute your python code. This file will be used as input for the code below.
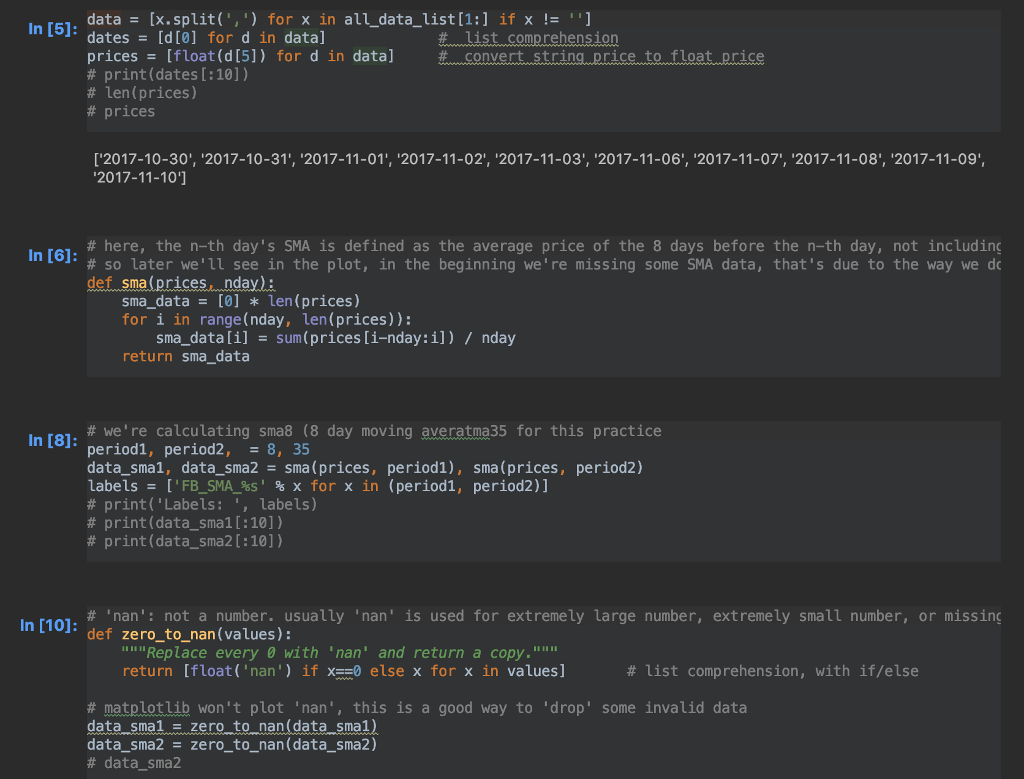
1. Write a function called "get_sma", that takes two input arguments, similar to the example provided. First argument is the original prices of type list, and 2nd input argument being the number of days we want to calculate SMA, like a 8 day sma or 35 day sma. This function should return a new list of sma price, based on the input day range, and should be able to handle any SMA calculation, like: sma200 for 200 days moving average.
2. Write a function called "read_data", which will be used to open/read/close of the csv file, as well as some data processing. We will be using the 'Adj Close' column as our 'prices'. This function should return 2 lists: a list of dates, and a list of original prices.
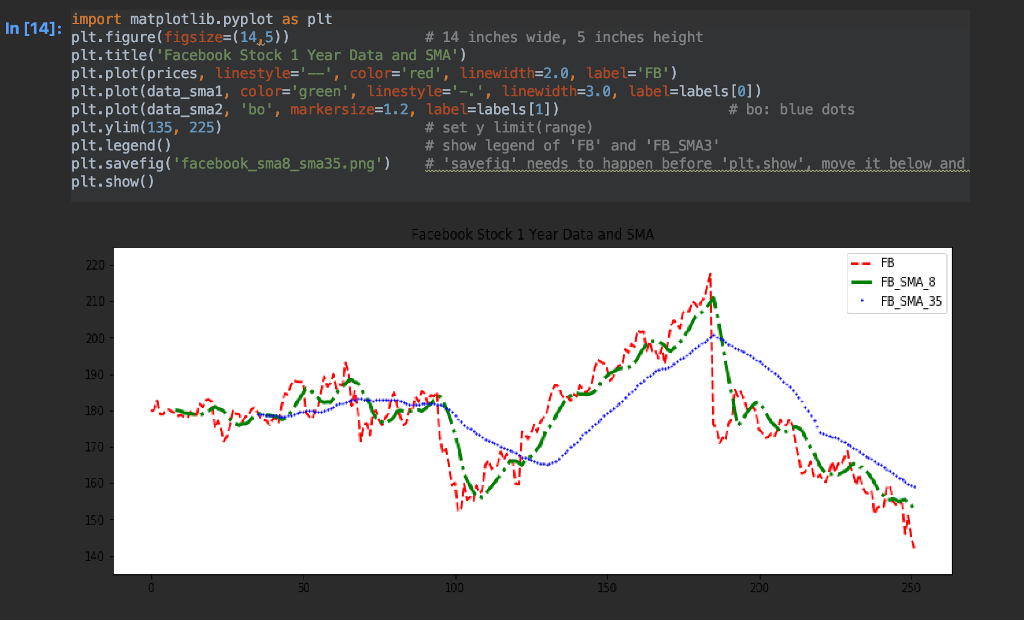
3. make another function called "make_plot", which will take 4 input arguments, all in list format. The 4 input lists are: dates, original prices, sma10 prices, sma50 prices (for 10 and 50 days moving average respectively). This function should use matplotlib to make plots and save image to harddisk.
To check your curves look right: After you make the plots, you can compare your plot to finance.yahoo.com plot of COST using 1 year and the two SMA curve added (please google on how to), or use any website you're familiar with that can make 1 year stock curve with sma10 and sma50, to see that your 3 curves have similar shape as on the website.
4. Write a function called "main", that will: call read_data to read in original price as a list
call get_sma to get sma10 and sma50 of costco stock prices, as 2 lists. "sma10" means the 10 day SMA data as a list.
call make_plot, using the 4 lists we have also make sure to write code that will call the 'main' function, so your python code can be executed.
Note: please make the code as clean as possible. No duplicated code. No unnecessary lines. Repeated code will get points deducted. Only nice and clean code can get full score.
for costco stock price plot, if you can make the x axis use dates instead of numbers in my example, you may get up to 10 points extra. Your plot may use something like: 01/2017, 02/2017, or : 2017.1, 2017.2, or Jan 2017, whatever way that can show clearly that it's a 'date' format.
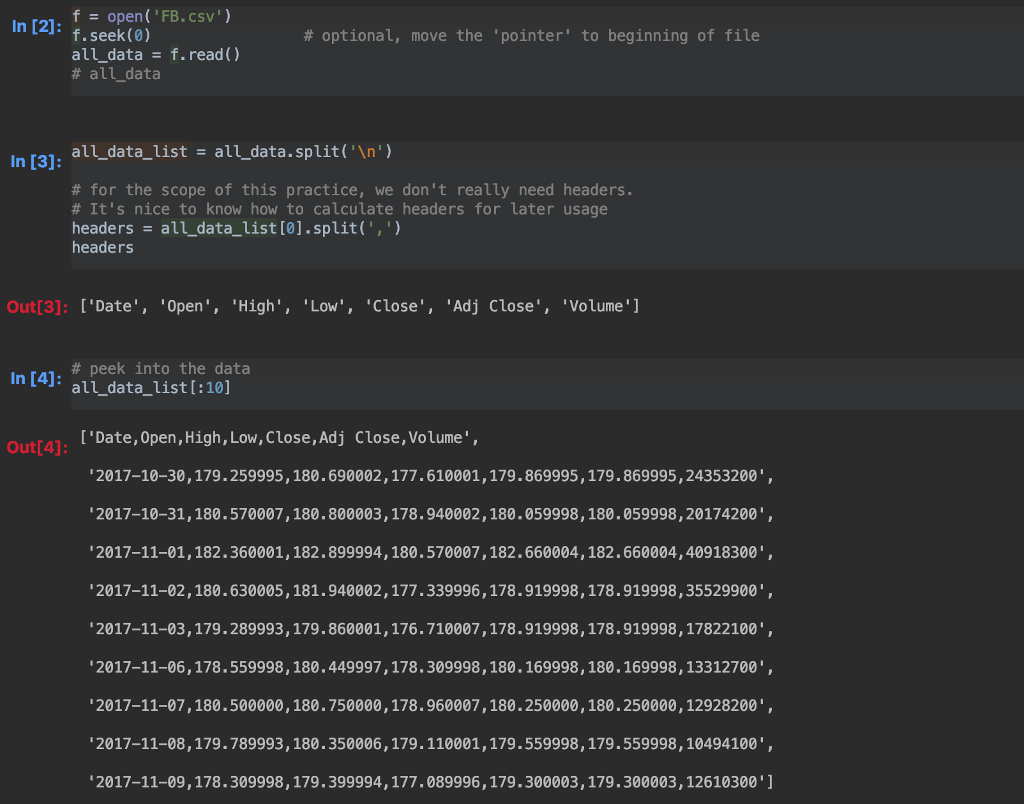
In [21: open ( 'FB. csv') # optional, move the 'pointer' to beginning of file all_data-f.read) # audata - all_data_list - all_data.split('n') In [3]: # for the scope of this practice, we don't really need headers. # It's nice to know how to calculate headers for later usage headers all_data_list[0].split(',') headers Out[3]: ['Date', 'Open', 'High', 'Low', 'Close', 'Adj Close', 'Volume' In [4]: all_data list [:101 # peek into the data all_data_list[:10] I'Date, Open,High, Low, Close,Adj Close, Volume', Out[4]: 2017-10-30, 179.259995, 180.690002,177.610001,179.869995,179.869995,24353200, 2017-10-31,180.570007,180.800003,178.940002,180.059998,180.059998,20174200 2017-11-01,182.360001,182.899994,180.570007,182.660004, 182.660004,40918300 2017-11-02,180.630005,181.940002,177.339996,178.919998,178.919998,35529900', 2017-11-03,179.289993,179.860001,176.710007,178.919998,178.919998,17822100', 2017-11-06,178.559998, 180.449997,178.309998,180.169998,180.169998,13312700' 2017-11-07,180.500000,180.750000,178.960007,180.250000, 180.250000,12928200' 2017-11-08,179.789993, 180.350006, 179.110001,179.559998,179.559998,10494100", 2017-11-09,178.309998, 179.399994,177.089996, 179.300003, 179.300003,12610300 '1 In [21: open ( 'FB. csv') # optional, move the 'pointer' to beginning of file all_data-f.read) # audata - all_data_list - all_data.split('n') In [3]: # for the scope of this practice, we don't really need headers. # It's nice to know how to calculate headers for later usage headers all_data_list[0].split(',') headers Out[3]: ['Date', 'Open', 'High', 'Low', 'Close', 'Adj Close', 'Volume' In [4]: all_data list [:101 # peek into the data all_data_list[:10] I'Date, Open,High, Low, Close,Adj Close, Volume', Out[4]: 2017-10-30, 179.259995, 180.690002,177.610001,179.869995,179.869995,24353200, 2017-10-31,180.570007,180.800003,178.940002,180.059998,180.059998,20174200 2017-11-01,182.360001,182.899994,180.570007,182.660004, 182.660004,40918300 2017-11-02,180.630005,181.940002,177.339996,178.919998,178.919998,35529900', 2017-11-03,179.289993,179.860001,176.710007,178.919998,178.919998,17822100', 2017-11-06,178.559998, 180.449997,178.309998,180.169998,180.169998,13312700' 2017-11-07,180.500000,180.750000,178.960007,180.250000, 180.250000,12928200' 2017-11-08,179.789993, 180.350006, 179.110001,179.559998,179.559998,10494100", 2017-11-09,178.309998, 179.399994,177.089996, 179.300003, 179.300003,12610300 '1
Step by Step Solution
There are 3 Steps involved in it

Get step-by-step solutions from verified subject matter experts