

Question: Description Overview In this assignment we will consider the assumptions of a t-test. If these assumptions are not met, you have to choose a different
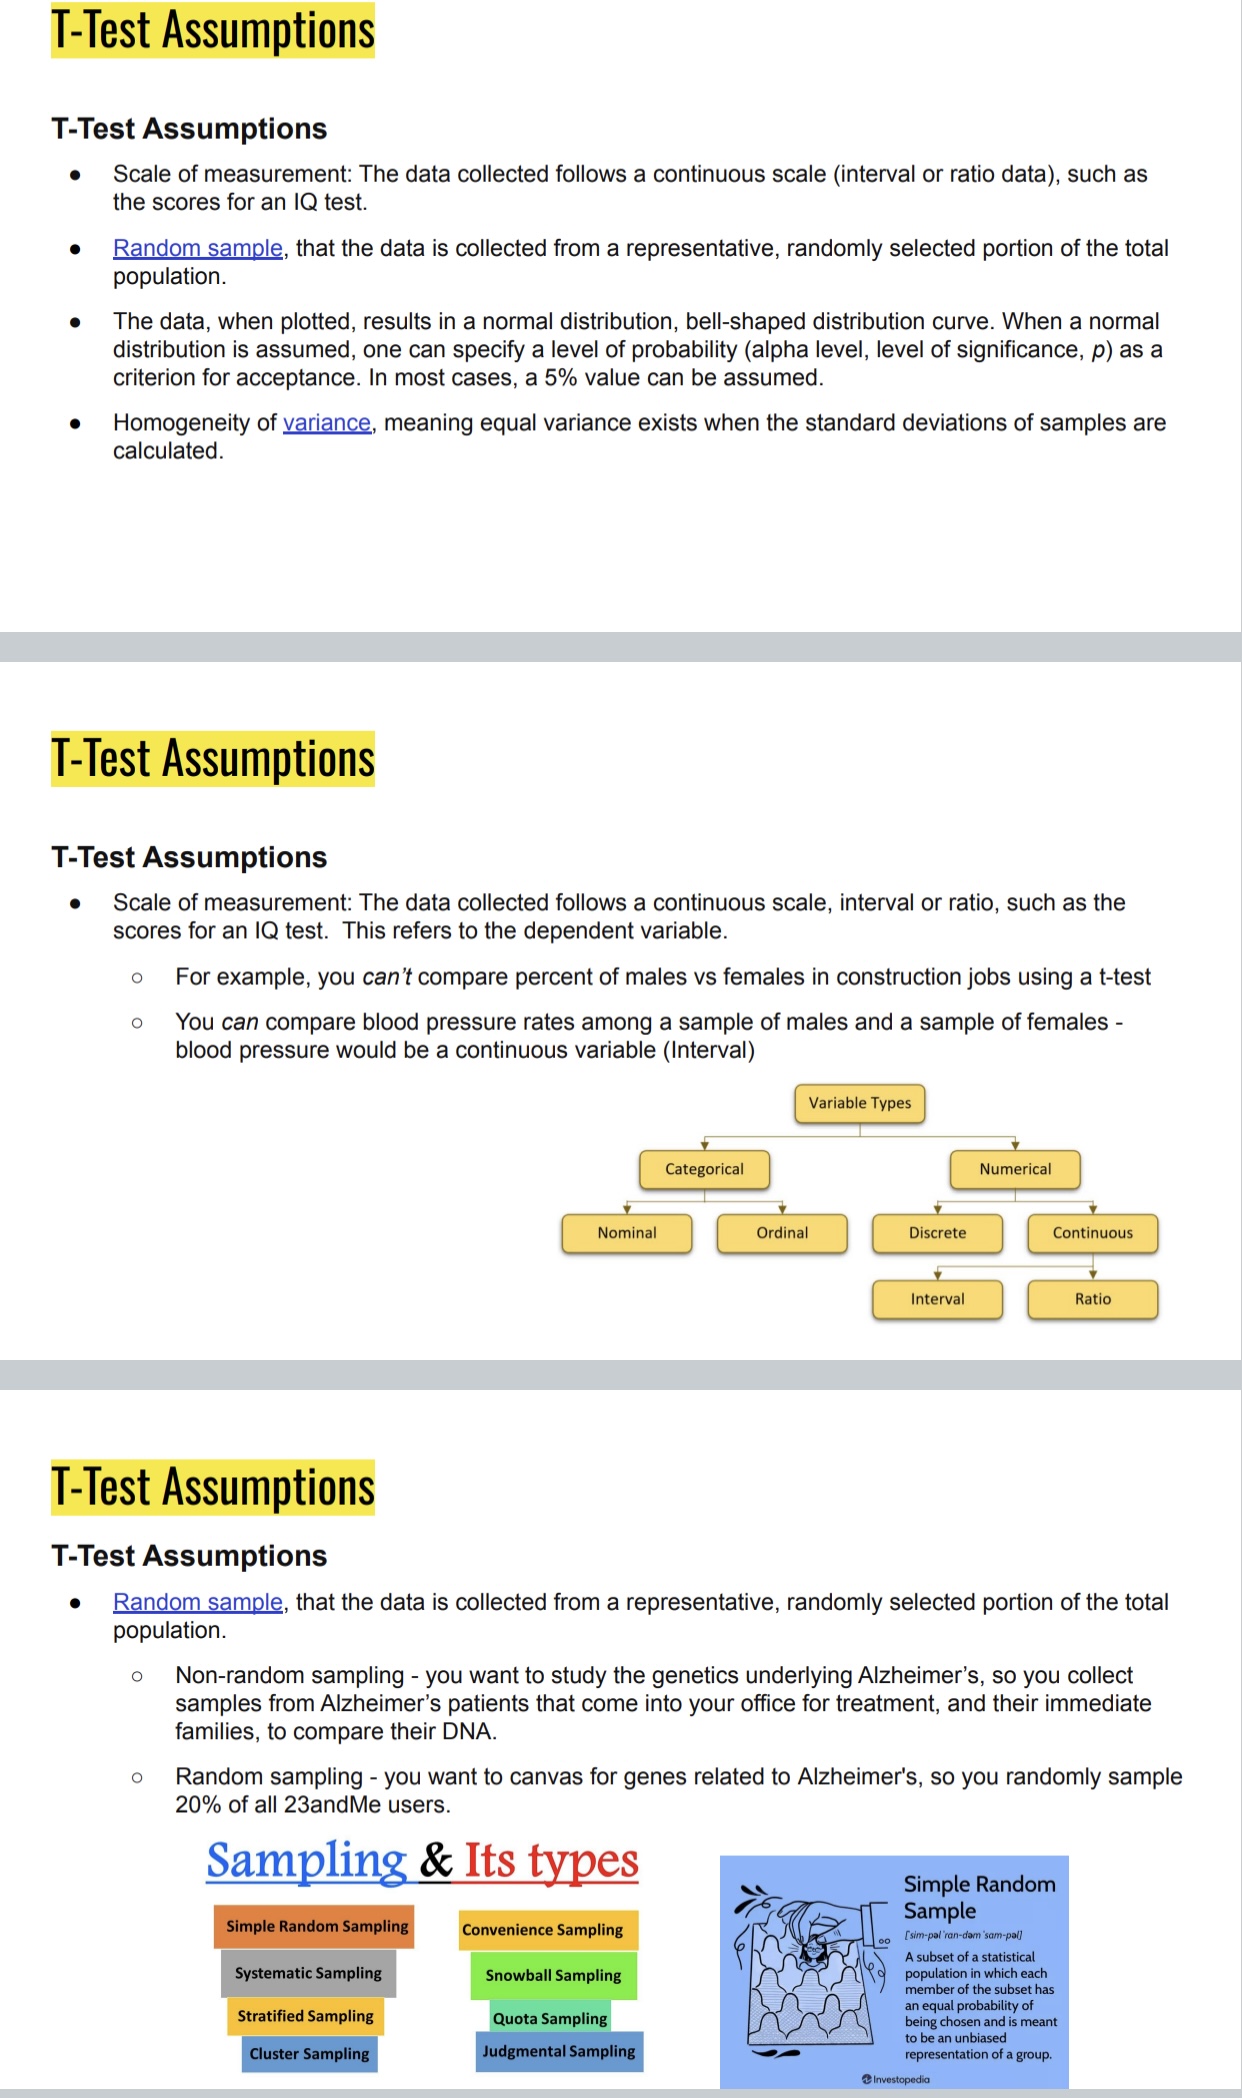
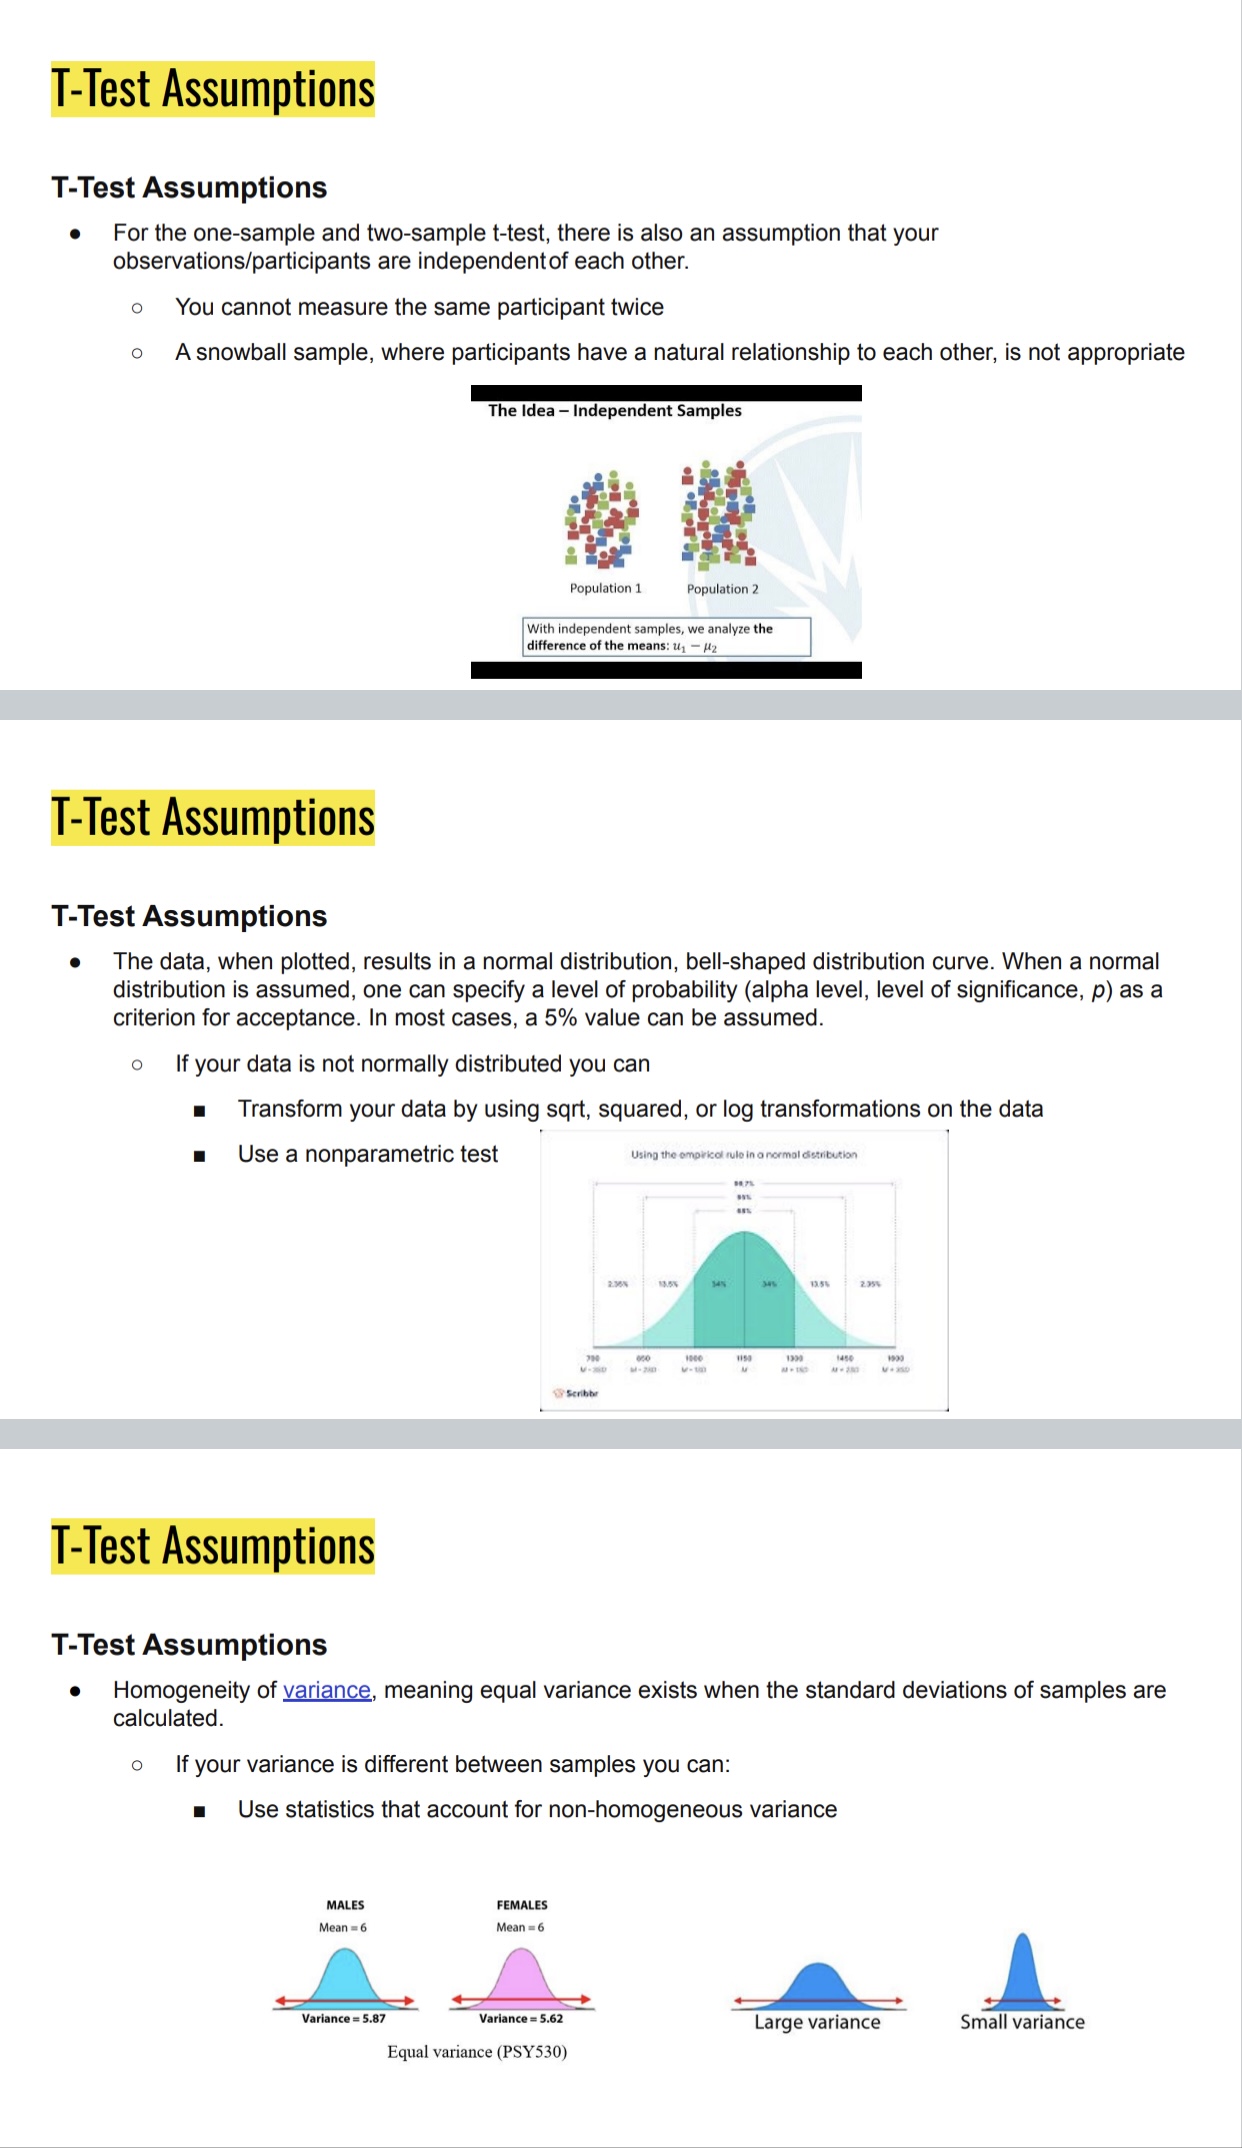
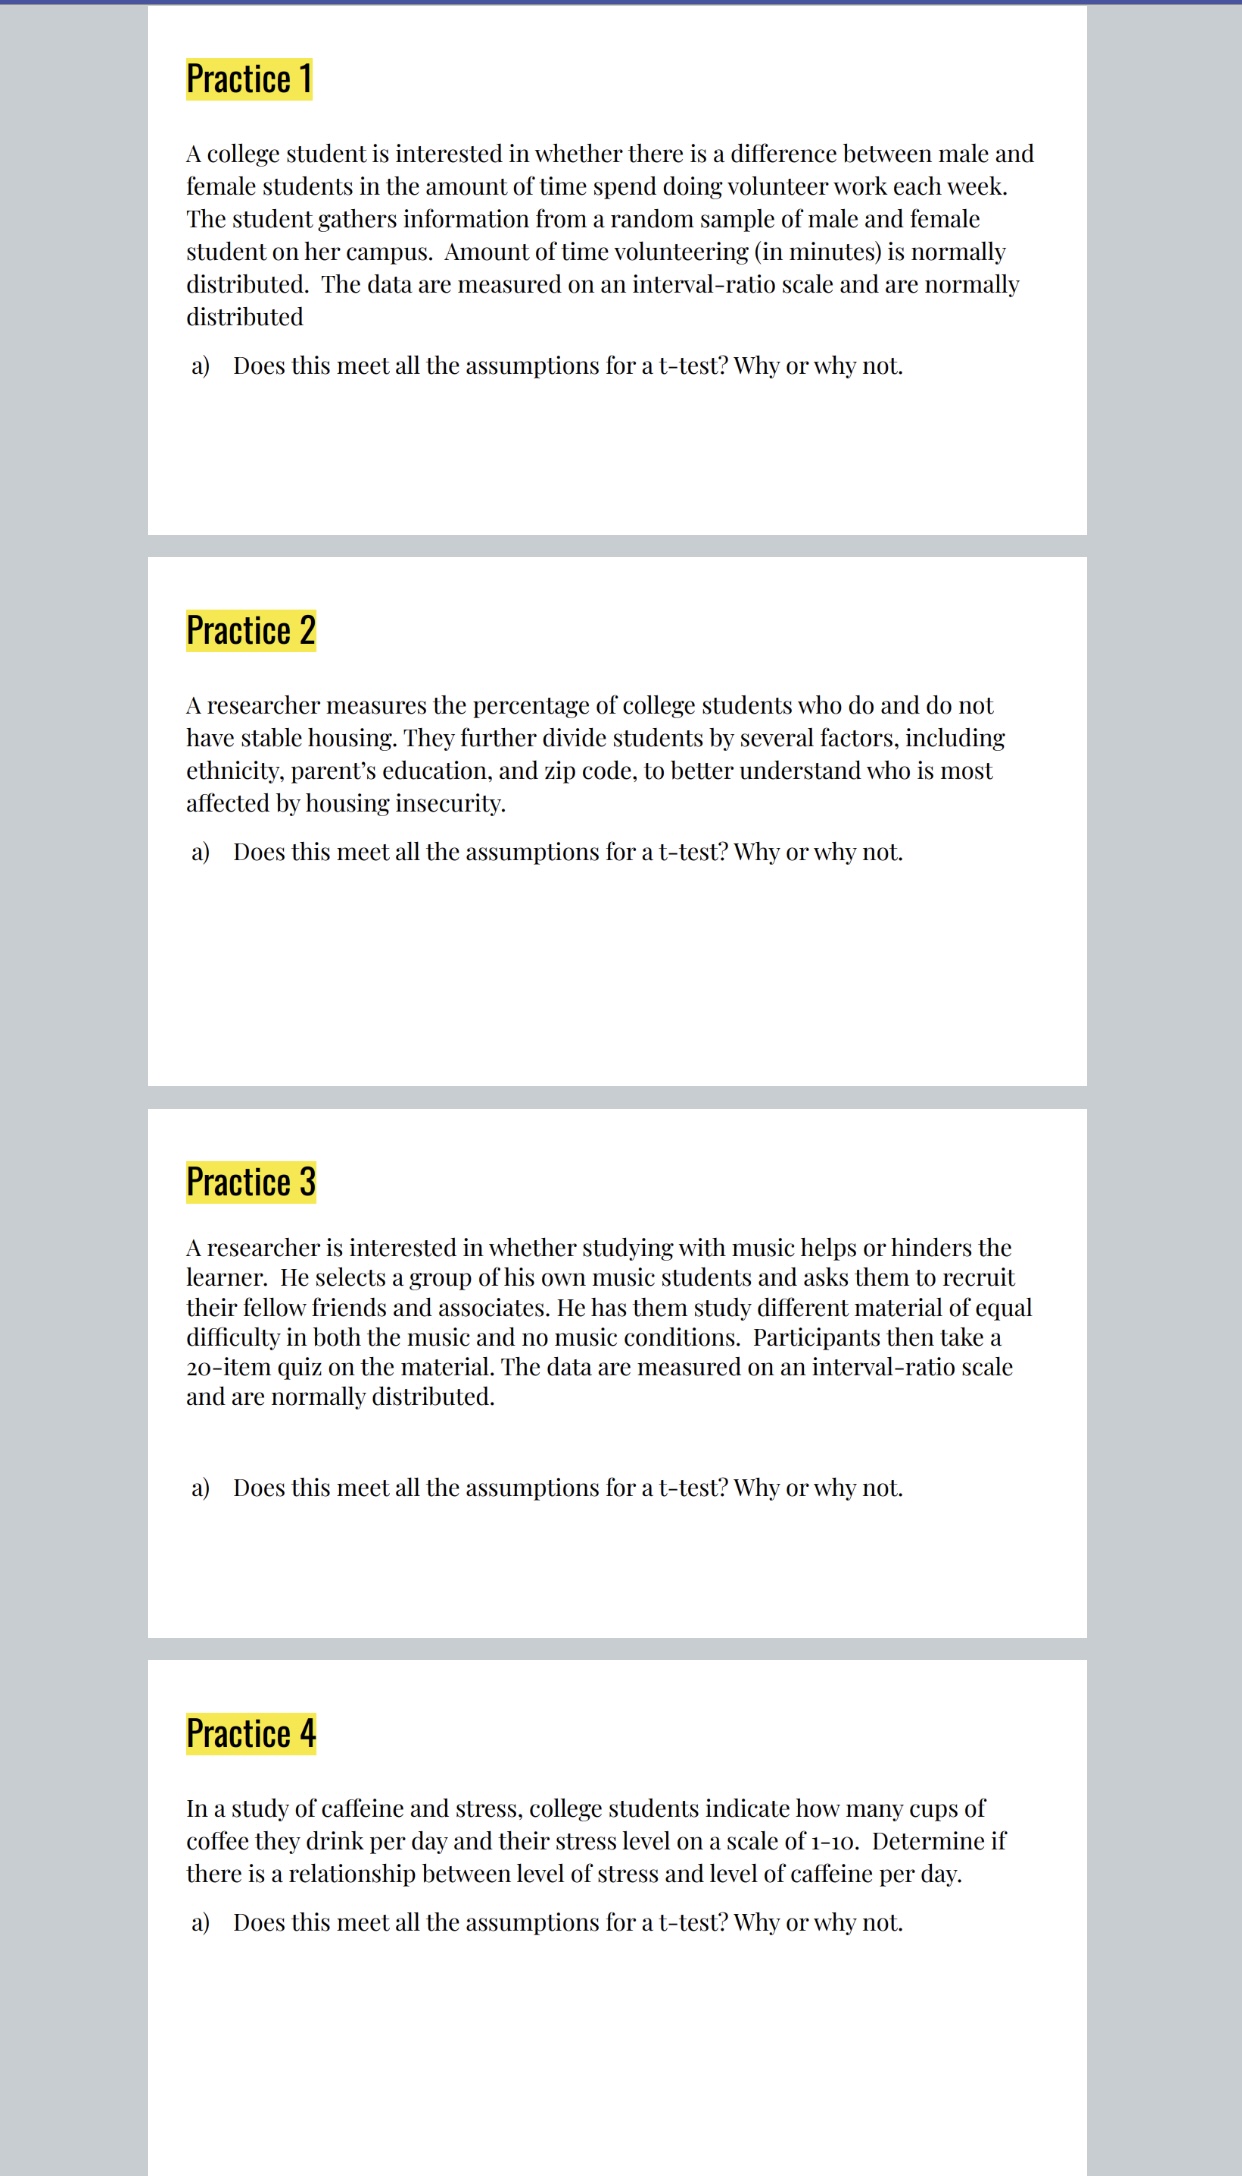
Description Overview In this assignment we will consider the assumptions of a t-test. If these assumptions are not met, you have to choose a different type of statistic, called a non- parametric test. There are many types of nonparimetric tests that we dont cover in this course, but | want you to be aware of them. The Assumptions These slides will give you an overview of the basic assumptions. T-Test Assumptions.pdf Assignment Practice trying to identify if each study is meeting the assumptions of a t-test. T-Test Assumptions T-Test Assumptions Scale of measurement: The data collected follows a continuous scale (interval or ratio data), such as the scores for an IQ test. Random sample, that the data is collected from a representative, randomly selected portion of the total population. The data, when plotted, results in a normal distribution, bell-shaped distribution curve. When a normal distribution is assumed, one can specify a level of probability (alpha level, level of significance, p) as a criterion for acceptance. In most cases, a 5% value can be assumed. Homogeneity of variance, meaning equal variance exists when the standard deviations of samples are calculated. T-Test Assumptions T-Test Assumptions Scale of measurement: The data collected follows a continuous scale, interval or ratio, such as the scores for an IQ test. This refers to the dependent variable. o For example, you can't compare percent of males vs females in construction jobs using a t-test o You can compare blood pressure rates among a sample of males and a sample of females - blood pressure would be a continuous variable (Interval) Variable Types Categorical Numerical Nominal Ordinal Discrete Continuous Interval Ratio T-Test Assumptions T-Test Assumptions Random sample, that the data is collected from a representative, randomly selected portion of the total population. O Non-random sampling - you want to study the genetics underlying Alzheimer's, so you collect samples from Alzheimer's patients that come into your office for treatment, and their immediate families, to compare their DNA. O Random sampling - you want to canvas for genes related to Alzheimer's, so you randomly sample 20% of all 23andMe users. Sampling & Its types Simple Random Sample Simple Random Sampling Convenience Sampling [sim-pal'ran-dam 'sam-pal] A subset of a statistical Systematic Sampling Snowball Sampling population in which each member of the subset has Stratified Sampling an equal probability of Quota Sampling being chosen and is meant to be an unbiased Cluster Sampling Judgmental Sampling representation of a group.T-Test Assumptions T-Test Assumptions For the one-sample and two-sample t-test, there is also an assumption that your observations/participants are independentof each other. o You cannot measure the same participant twice o A snowball sample, where participants have a natural relationship to each other, is not appropriate The Idea - Independent Samples Population 1 Population 2 With independent samples, we analyze the difference of the means: 1 - Hz T-Test Assumptions T-Test Assumptions . The data, when plotted, results in a normal distribution, bell-shaped distribution curve. When a normal distribution is assumed, one can specify a level of probability (alpha level, level of significance, p) as a criterion for acceptance. In most cases, a 5% value can be assumed. If your data is not normally distributed you can Transform your data by using sqrt, squared, or log transformations on the data Use a nonparametric test Using the empirical rule in a normal distribution 1 Scribb T-Test Assumptions T-Test Assumptions Homogeneity of variance, meaning equal variance exists when the standard deviations of samples are calculated. If your variance is different between samples you can: Use statistics that account for non-homogeneous variance MALES FEMALES Mean = 6 Mean = 6 Variance = 5.87 Variance = 5.62 Large variance Small variance Equal variance (PSY530)A college student is interested in whether there is a difference between male and female students in the amount of time spend doing volunteer work each week. The student gathers information from a random sample of male and female student on her campus. Amount of time volunteering (in minutes) is normally distributed. The data are measured on an interval-ratio scale and are normally distributed a) Does this meet all the assumptions for a t-test? Why or why not. A researcher measures the percentage of college students who do and do not have stable housing. They further divide students by several factors, including ethnicity, parent's education, and zip code, to better understand who is most affected by housing insecurity. a) Does this meet all the assumptions for a t-test? Why or why not. A researcher is interested in whether studying with music helps or hinders the learner. He selects a group of his own music students and asks them to recruit their fellow friends and associates. He has them study different material of equal difficulty in both the music and no music conditions. Parlicipants then lake a 20-item quiz on the material. The data are measured on an interval-ratio scale and are normally distributed. a) Does this meet all the assumptions for a t-test? Why or why not. In a study of caffeine and stress, college students indicate how many cups ol coffee they drink per day and their stress level on a scale of 1-10. Determine if there is a relationship between level of stress and level of caffeine per day. a) Does this meet all the assumptions for a t-test? Why or why not
Step by Step Solution
There are 3 Steps involved in it

Get step-by-step solutions from verified subject matter experts