

Question: Description: The relationship/activity-based supply chain map for semiconductors is presented in this report. The focal firm is the semiconductors manufacturer (such as Texas Instruments, Samsung,
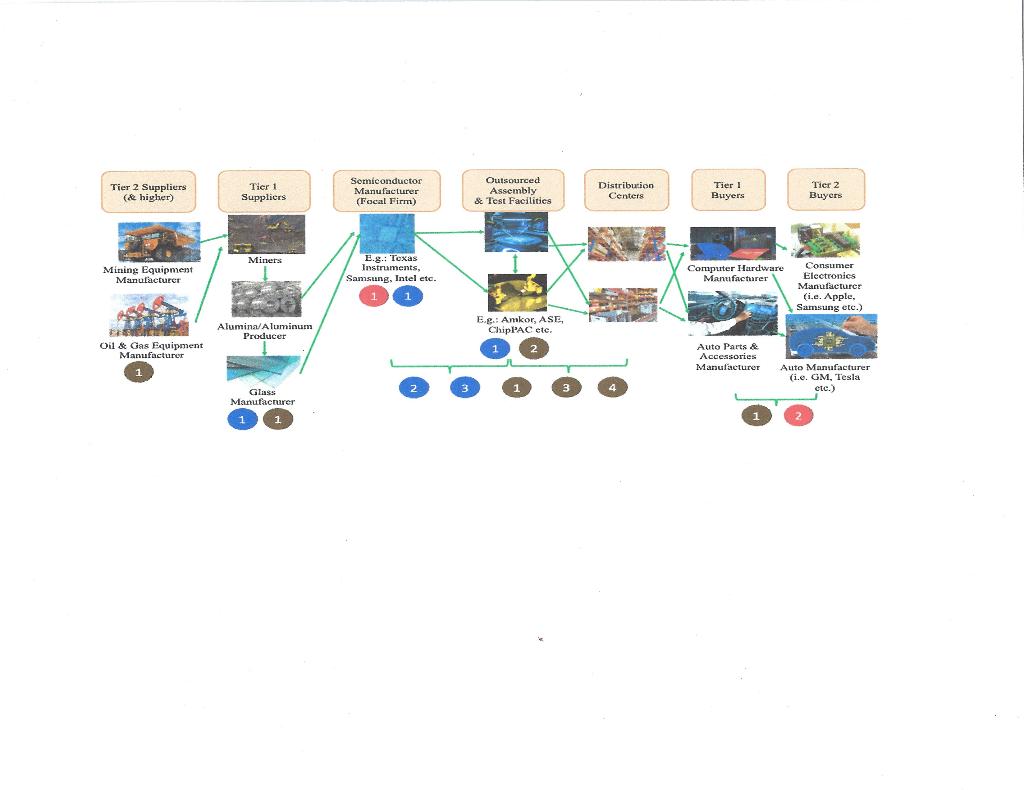
Description: The relationship/activity-based supply chain map for semiconductors is presented in this report. The focal firm is the semiconductors manufacturer (such as Texas Instruments, Samsung, Intel etc.) that manufactures electronic components made with semiconductor materials such as silicon (Mieles, 2021). Tier 1 suppliers to the semiconductor manufacturers include miners, aluminum & alumina producers, and glass manufacturers, which in turn, are supported by mining and oil & gas equipment manufacturers (or, Tier 2 Suppliers) (Mieles, 2021). Downstream to the focal firm are the assembly and testing facilities (Amkor, ASE etc.) where the manufactured products go for verification & validation before eventually ending up in the distribution centers for the semiconductor original equipment manufacturers (Nathan Associates, 2016). The major Tier 1 buyers for the semiconductors are the computer hardware and auto-parts manufacturers which serve as contract manufacturers for the leading consumer electronics (Apple, Samsung, Whirlpool etc.) & auto companies (Tesla, GM etc.), or the Tier 2 buyers (Mieles, 2021).
Areas of Sustainability Vulnerability: The vulnerabilities across three pillars of sustainability (Weisser, 2014) are as follows:
Environmental: The global energy use of products featuring semiconductors has doubled every three years since 2010 (Mann & Putsche, 2022). This rapidly rising use of semiconductors (in electrification and energy-intensive computer applications i.e., artificial intelligence) contributes to the climate change, which in-turn, impacts the planet earth and its ecosystem negatively (Mann & Putsche, 2022). Besides, the semiconductor manufacturing has been shifting from developed nations such as Japan and Germany to Asia due to low cost of production influenced by lower labor rates and exchange rates (Mieles, 2021). Furthermore, the carbon emission penalties are quite low in China as compared to developed nations (Taplin, 2023) thereby incentivizing excessive production in China while hampering the wildlife & the surrounding environment.
Social: Given the relaxed labor laws overseas (The Economist, 2017), the local communities are hurting as profit seeking entities continue to extract and pocket higher output from developing nations and have done little to promote the society. Moreover, the ongoing trade war between U.S. and China has also led to social imbalance through their unequal/unfavorable treatment towards each other which is hurting both the countries and their respective supply chains (Brown, 2022). Similarly, there is growing concern that Chinas investment polices treat foreign firms unfairly through their improper use of subsidies (Huang, 2021). This is something China can improve by incorporating favorable incentives to promote international relationships & investments.
Economic: The globalization of the semiconductor industry is quite high (Mieles, 2021) and their core competency lies in the knowledge transfer and technological advancements. One of the perils of continuous evolvement is the need for technology upgrades throughout the supply chain which may not be economically viable for small manufacturers (Nathan Associates, 2016). Similarly, a decreasing manufacturing base of semiconductors in the United States (26% in 1995 versus 10% by 2020) (Mann & Putsche, 2022) as well as highly outsourced assembly/test facilities (Nathan Associates, 2016) pose a threat to its domestic economic growth & supply chain sustainability. This vulnerability was also evident from the chip shortages that impacted auto-makers (James, 2023) and, also, when a giant ship got stuck in Suez Canal (Yee & Glanz, 2021). Additionally, the trade war between U.S. and China is hurting the global economy where total U.S. imports from China have reduced since the war started (Bown, 2022). Inadequate intellectual property safeguards within China (Huang, 2021) further adds to financial woes where duplicate and counterfeit products are flooding the international markets thereby hurting the long-term financial feasibility and promoting unhealthy competition.
Evaluate the relationship/activity-base supply chain map shown above and identify potential areas for sustainability vulnerability and provide THREE potential additional improvements you believe would add value to this map.
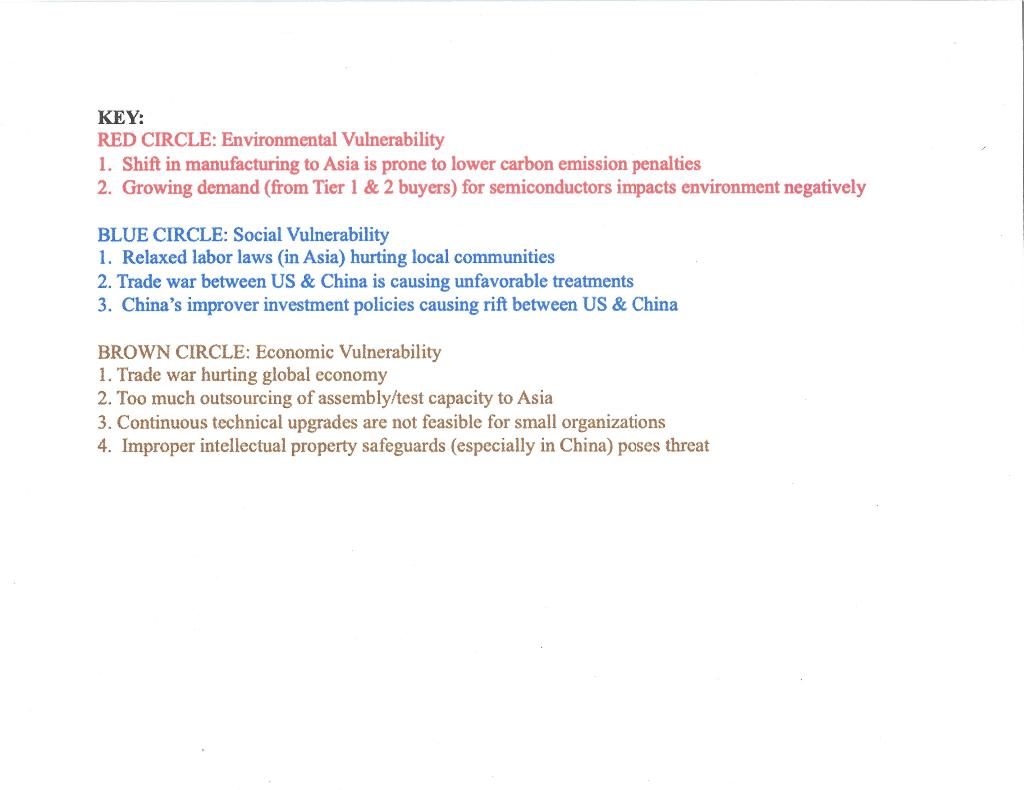
KEY: RED CIRCLE: Environmental Vulnerability 1. Shift in manufacturing to Asia is prone to lower carbon emission penalties 2. Growing demand (from Tier 1 \& 2 buyers) for semiconductors impacts environment negatively BLUE CIRCLE: Social Vulnerability 1. Relaxed labor laws (in Asia) hurting local communities 2. Trade war between US \& China is causing unfavorable treatments 3. China's improver investment policies causing rift between US \& China BROWN CIRCLE: Economic Vulnerability 1. Trade war hurting global economy 2. Too much outsourcing of assembly/test capacity to Asia 3. Continuous technical upgrades are not feasible for small organizations 4. Improper intellectual property safeguards (especially in China) poses threat
Step by Step Solution
There are 3 Steps involved in it

Get step-by-step solutions from verified subject matter experts