

Question: Descriptive Statistics 1 X Frequency X *F Rel FREQ % 12 INP 13 25 22 13 Determine the expected value of the distribution above. Determine
Descriptive Statistics
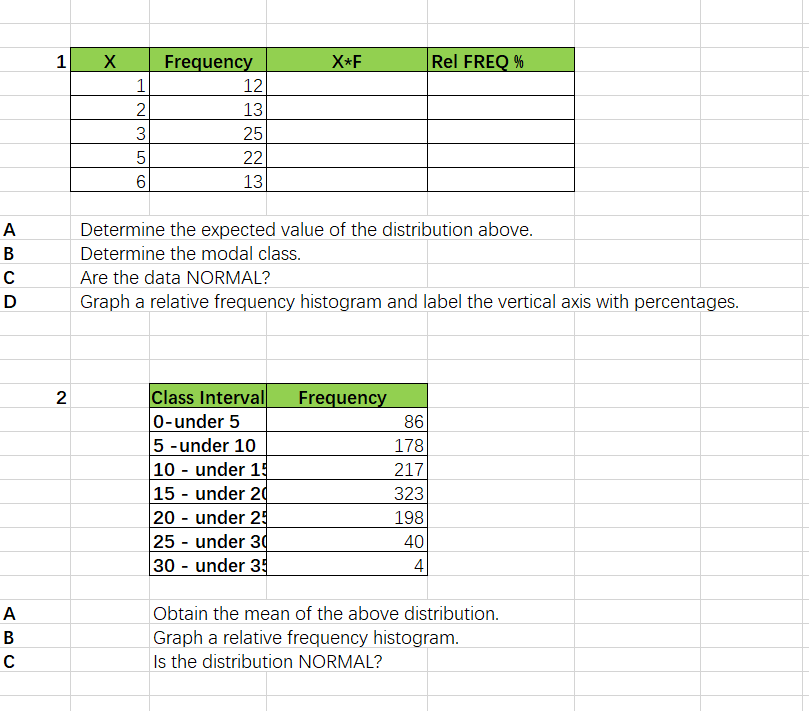
1 X Frequency X *F Rel FREQ % 12 INP 13 25 22 13 Determine the expected value of the distribution above. Determine the modal class. Are the data NORMAL? Graph a relative frequency histogram and label the vertical axis with percentages. 2 Class Interval Frequency 0-under 5 86 5 - under 10 178 10 - under 15 217 15 - under 2 323 20 - under 25 198 25 - under 3 40 30 - under 35 4 Obtain the mean of the above distribution. Graph a relative frequency histogram. Is the distribution NORMAL?[Gurney time, 1.\" (mins) Frequency 0
Step by Step Solution
There are 3 Steps involved in it
1 Expert Approved Answer
Step: 1 Unlock

Question Has Been Solved by an Expert!
Get step-by-step solutions from verified subject matter experts
Step: 2 Unlock
Step: 3 Unlock