

Question: Descriptive statistics; A) q1= q3= . B) Find interquartile IQR= C) Calculate a lower boundary using q1-1.5 IQR. Calculate a upper boundary using q3+1.5. D)
Descriptive statistics; A) q1= q3= . B) Find interquartile IQR= C) Calculate a lower boundary using q1-1.5 IQR. Calculate a upper boundary using q3+1.5. D) Any values less than the lower boundary or greater than the upper boundary are considered outliers. Identify all the outliers of the data set. If there is more than one outlier separate them with commas. If there are no outliers click none
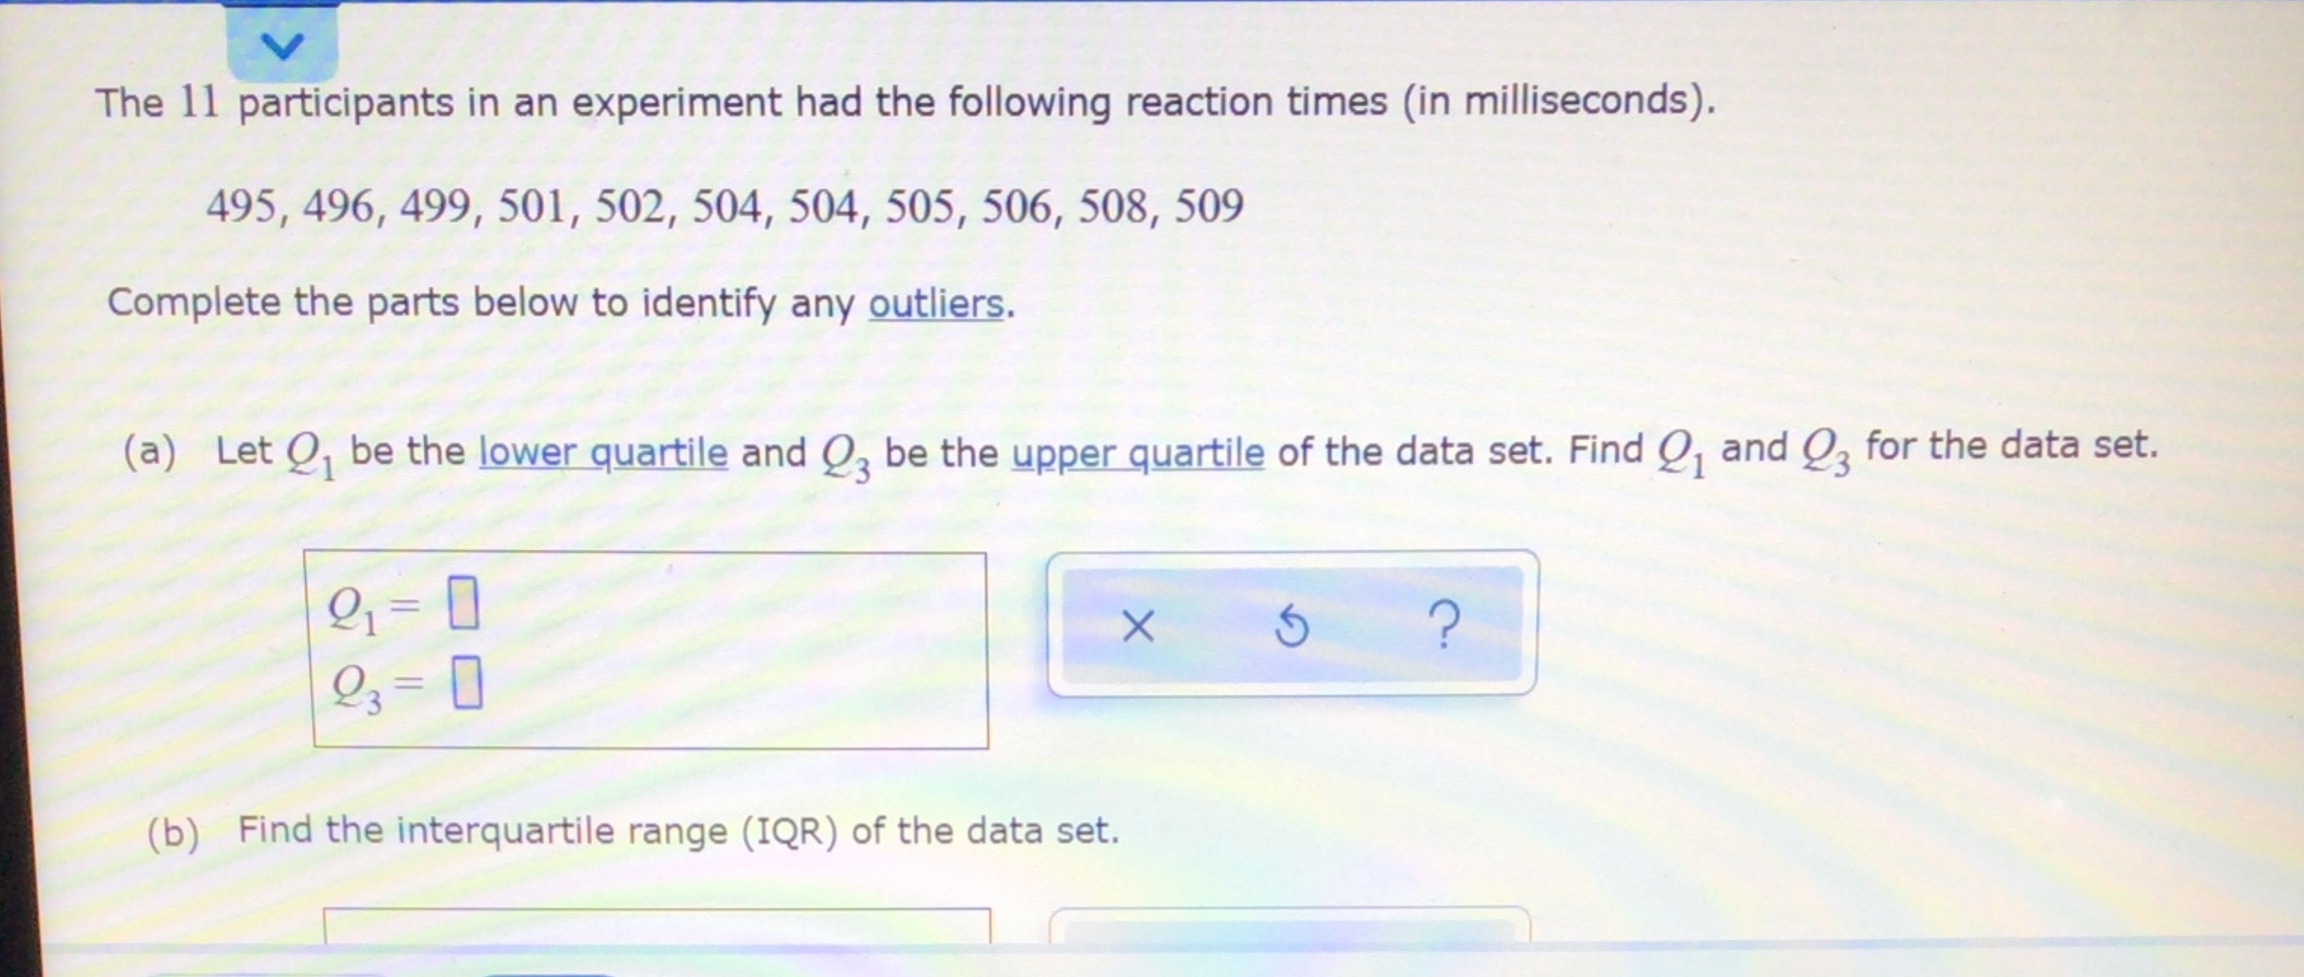
The 11 participants in an experiment had the following reaction times (in milliseconds). 495, 496, 499, 501, 502, 504, 504, 505, 506, 508, 509 Complete the parts below to identify any outliers. (a) Let Q, be the lower quartile and O? be the upper quartile of the data set. Find Q, and Q3 for the data set. 21 = X ? 23 = 0 (b) Find the interquartile range (IQR) of the data set
Step by Step Solution
There are 3 Steps involved in it

Get step-by-step solutions from verified subject matter experts