

Question: Descriptive statistics. A) q1= q3=. B) IQR = . C) lower boundary =[ ]upper boundary =[ ]q1-1.5 q3+1.5 D) Any values less than the lower
Descriptive statistics. A) q1= q3=. B) IQR = . C) lower boundary =[ ]upper boundary =[ ]q1-1.5 q3+1.5 D) Any values less than the lower boundary or greater than the upper boundary are considered outliers. Identify all the outliers of the data set. If there is more than one outlier. Separate them with commas, if there are no outliers click none
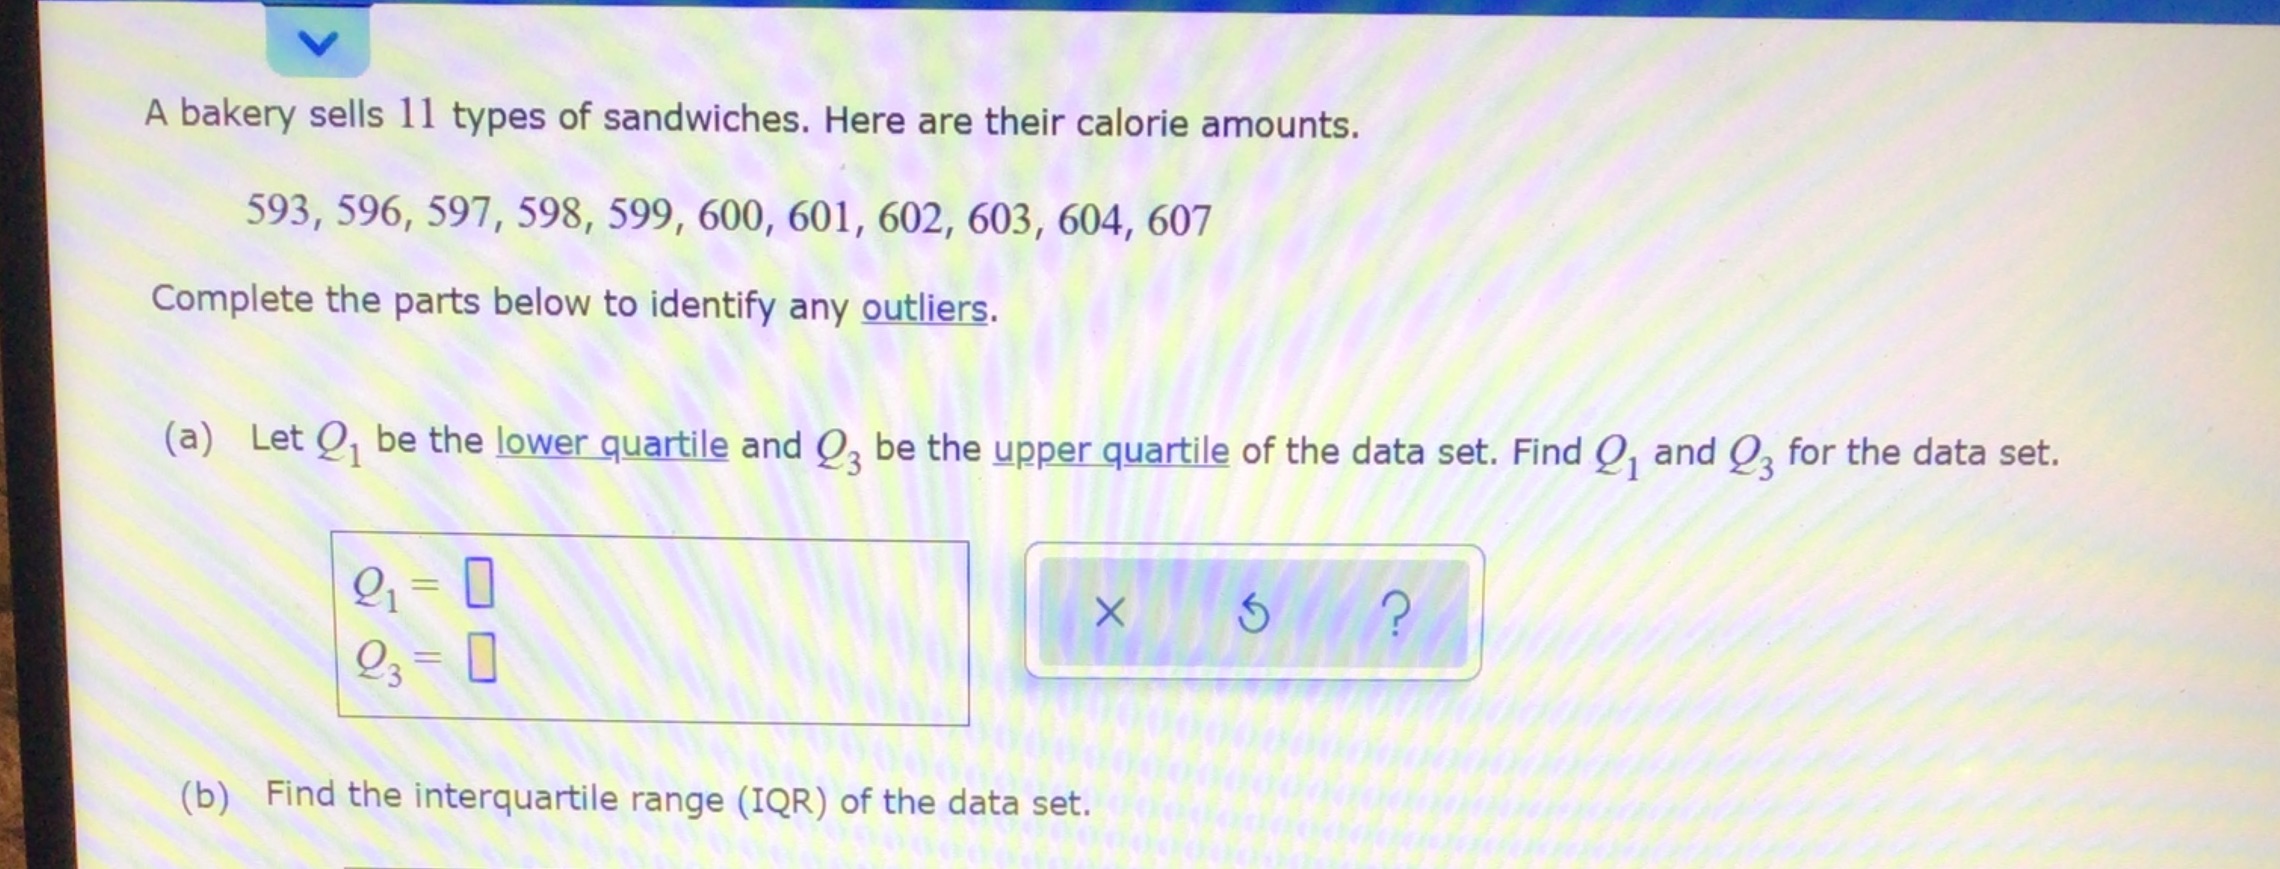
A bakery sells 11 types of sandwiches. Here are their calorie amounts. 593, 596, 597, 598, 599, 600, 601, 602, 603, 604, 607 Complete the parts below to identify any outliers. (a) Let Q1 be the 1mm and Q3 be the gpmgLiIe of the data set. Find Q1 and Q3 for the data set. ' 'l?(;,'_'5\"i?'a,1 (b) Find the interquartile range (IQR) of the data set
Step by Step Solution
There are 3 Steps involved in it

Get step-by-step solutions from verified subject matter experts