

Question: Descriptive Statistics Descriptive Statistics final lower division upper division Valid 49 56 Missing 0 0 Mean 61.469 62.161 Std. Deviation 8.595 6.747 Minimum 40.000 50.000
Descriptive Statistics
| Descriptive Statistics | |||||
|---|---|---|---|---|---|
| final | |||||
| lower division | upper division | ||||
| Valid | 49 | 56 | |||
| Missing | 0 | 0 | |||
| Mean | 61.469 | 62.161 | |||
| Std. Deviation | 8.595 | 6.747 | |||
| Minimum | 40.000 | 50.000 | |||
| Maximum | 75.000 | 74.000 | |||
Distribution Plots
final
lower division
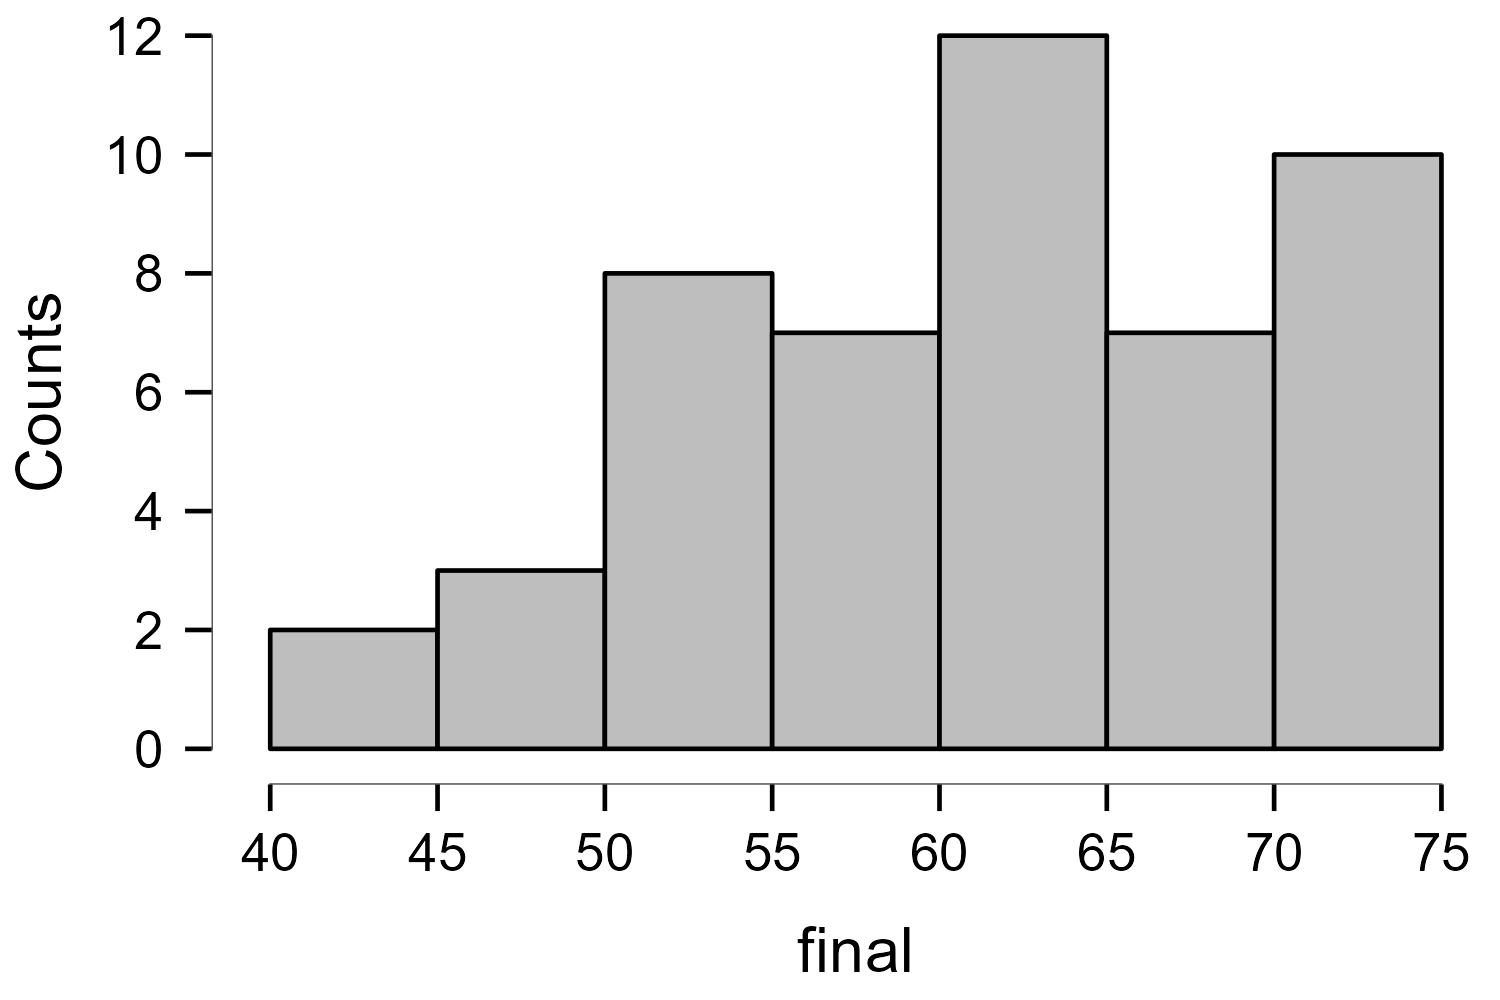
12 10 OC Counts O 4 N O 40 45 50 55 60 65 70 75 final\f
Step by Step Solution
There are 3 Steps involved in it
1 Expert Approved Answer
Step: 1 Unlock

Question Has Been Solved by an Expert!
Get step-by-step solutions from verified subject matter experts
Step: 2 Unlock
Step: 3 Unlock