

Question: Eb httpsweam-up-cast-prod-feat-x/th.content blackboardodnes.. Ten Save your output frequently to avoid losing your work. Remember that you need to be in the Output window to save
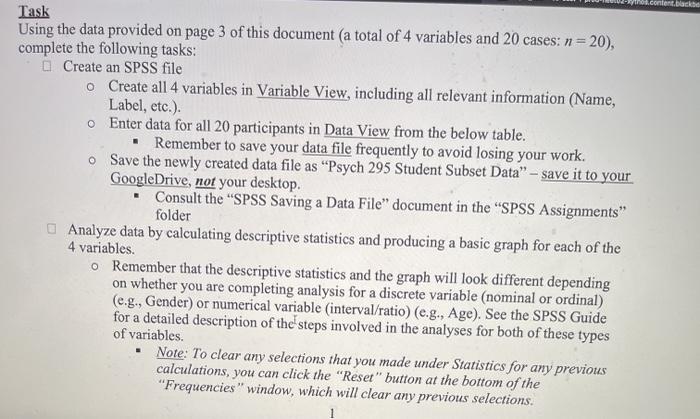
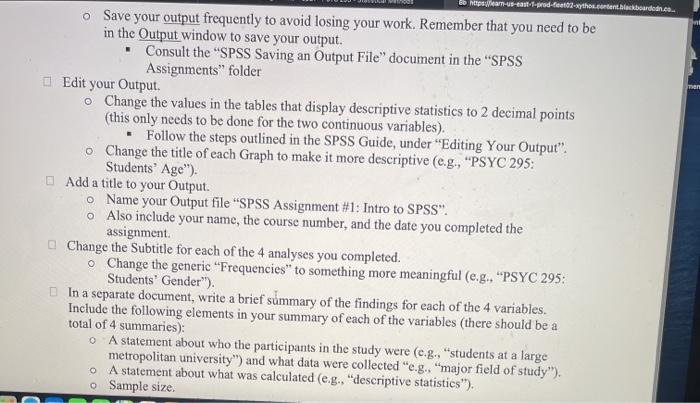
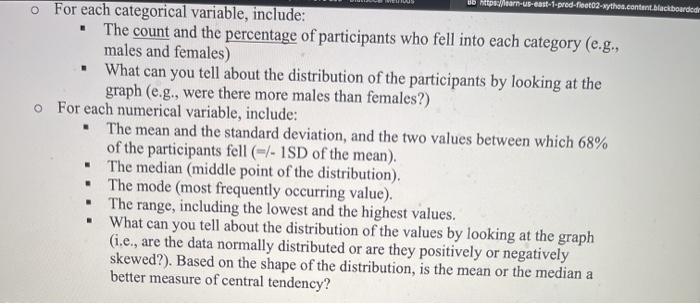
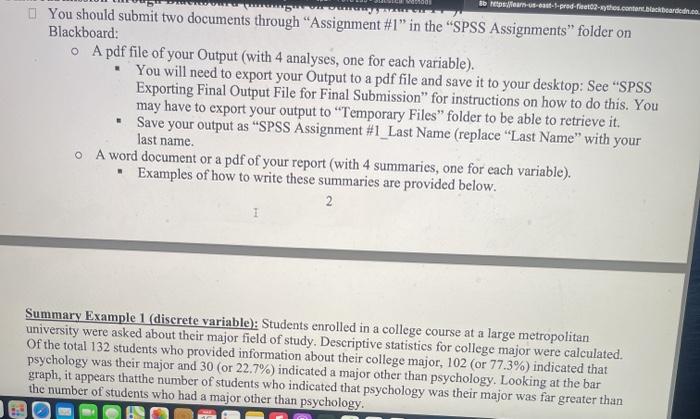
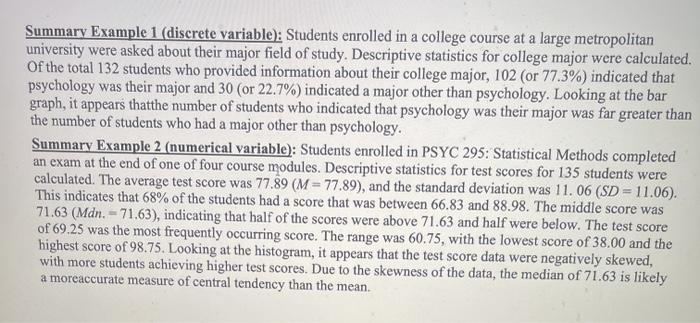
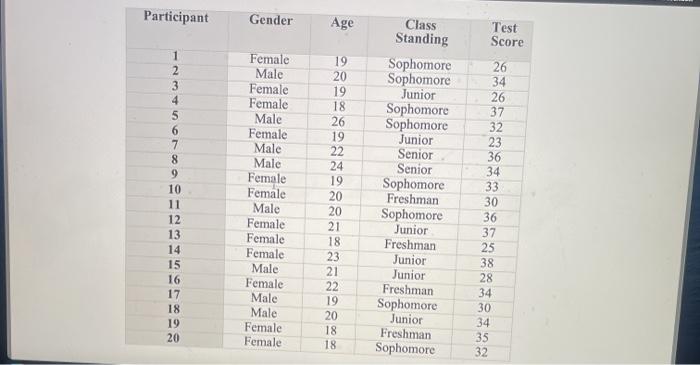
Eb httpsweam-up-cast-prod-feat-x/th.content blackboardodnes.. Ten Save your output frequently to avoid losing your work. Remember that you need to be in the Output window to save your output. Consult the "SPSS Saving an Output File" document in the "SPSS Assignments" folder Edit your Output o Change the values in the tables that display descriptive statistics to 2 decimal points (this only needs to be done for the two continuous variables). Follow the steps outlined in the SPSS Guide, under "Editing Your Output". o Change the title of each Graph to make it more descriptive (e.g., "PSYC 295: Students' Age"). Add a title to your Output. Name your Output file "SPSS Assignment #1: Intro to SPSS". Also include your name, the course number, and the date you completed the assignment Change the Subtitle for each of the 4 analyses you completed. o Change the generic "Frequencies" to something more meaningful (e.g., "PSYC 295: Students' Gender"). In a separate document, write a brief summary of the findings for each of the 4 variables. Include the following elements in your summary of each of the variables (there should be a total of 4 summaries): A statement about who the participants in the study were (e.g., "students at a large metropolitan university) and what data were collected "e.g., "major field of study"). A statement about what was calculated (e.g., "descriptive statistics"). o Sample size. Bb http://learn-us-east-1-pred-fleet2.wythos.content.blackboarded . o For each categorical variable, include: The count and the percentage of participants who fell into each category (e.g., males and females) What can you tell about the distribution of the participants by looking at the graph (e.g., were there more males than females?) o For each numerical variable, include: The mean and the standard deviation, and the two values between which 68% of the participants fell (=/- 1SD of the mean). The median (middle point of the distribution). . The mode (most frequently occurring value). The range, including the lowest and the highest values. What can you tell about the distribution of the values by looking at the graph (i.e., are the data normally distributed or are they positively or negatively skewed?). Based on the shape of the distribution, is the mean or the median a better measure of central tendency? . Bb Pets fear-seat-grad fetch.content blackboard.co 7 You should submit two documents through Assignment #1" in the "SPSS Assignments" folder on Blackboard: O A pdf file of your Output (with 4 analyses, one for each variable). . You will need to export your Output to a pdf file and save it to your desktop: See "SPSS Exporting Final Output File for Final Submission for instructions on how to do this. You may have to export your output to "Temporary Files" folder to be able to retrieve it. Save your output as "SPSS Assignment #1 _Last Name (replace "Last Name" with your last name. A word document or a pdf of your report (with 4 summaries, one for each variable). . Examples of how to write these summaries are provided below. 2 1 Summary Example 1 (discrete variable): Students enrolled in a college course at a large metropolitan university were asked about their major field of study. Descriptive statistics for college major were calculated. Of the total 132 students who provided information about their college major, 102 (or 77.3%) indicated that psychology was their major and 30 (or 22.7%) indicated a major other than psychology. Looking at the bar graph, it appears thatthe number of students who indicated that psychology was their major was far greater than the number of students who had a major other than psychology. Summary Example 1 (discrete variable): Students enrolled in a college course at a large metropolitan university were asked about their major field of study. Descriptive statistics for college major were calculated. Of the total 132 students who provided information about their college major, 102 (or 77.3%) indicated that psychology was their major and 30 (or 22.7%) indicated a major other than psychology. Looking at the bar graph, it appears thatthe number of students who indicated that psychology was their major was far greater than the number of students who had a major other than psychology. Summary Example 2 (numerical variable): Students enrolled in PSYC 295: Statistical Methods completed an exam at the end of one of four course modules. Descriptive statistics for test scores for 135 students were calculated. The average test score was 77.89 (M = 77.89), and the standard deviation was 11.06 (SD = 11.06). This indicates that 68% of the students had a score that was between 66.83 and 88.98. The middle score was 71.63 (Mdn. - 71.63), indicating that half of the scores were above 71.63 and half were below. The test score of 69.25 was the most frequently occurring score. The range was 60.75, with the lowest score of 38.00 and the highest score of 98.75. Looking at the histogram, it appears that the test score data were negatively skewed, with more students achieving higher test scores. Due to the skewness of the data, the median of 71.63 is likely a moreaccurate measure of central tendency than the mean. Participant Gender Age Test Score 1 2 3 4 5 6 8 9 10 11 12 13 14 15 16 17 18 19 20 Female Male Female Female Male Female Male Male Female Female Male Female Female Female Male Female Male Male Female Female 19 20 19 18 26 19 22 24 19 20 20 21 18 23 21 Class Standing Sophomore Sophomore Junior Sophomore Sophomore Junior Senior Senior Sophomore Freshman Sophomore Junior Freshman Junior Junior Freshman Sophomore Junior Freshman Sophomore 26 34 26 37 32 23 36 34 33 30 36 37 25 38 28 34 30 34 35 32 22 19 20 18 18 Eb httpsweam-up-cast-prod-feat-x/th.content blackboardodnes.. Ten Save your output frequently to avoid losing your work. Remember that you need to be in the Output window to save your output. Consult the "SPSS Saving an Output File" document in the "SPSS Assignments" folder Edit your Output o Change the values in the tables that display descriptive statistics to 2 decimal points (this only needs to be done for the two continuous variables). Follow the steps outlined in the SPSS Guide, under "Editing Your Output". o Change the title of each Graph to make it more descriptive (e.g., "PSYC 295: Students' Age"). Add a title to your Output. Name your Output file "SPSS Assignment #1: Intro to SPSS". Also include your name, the course number, and the date you completed the assignment Change the Subtitle for each of the 4 analyses you completed. o Change the generic "Frequencies" to something more meaningful (e.g., "PSYC 295: Students' Gender"). In a separate document, write a brief summary of the findings for each of the 4 variables. Include the following elements in your summary of each of the variables (there should be a total of 4 summaries): A statement about who the participants in the study were (e.g., "students at a large metropolitan university) and what data were collected "e.g., "major field of study"). A statement about what was calculated (e.g., "descriptive statistics"). o Sample size. Bb http://learn-us-east-1-pred-fleet2.wythos.content.blackboarded . o For each categorical variable, include: The count and the percentage of participants who fell into each category (e.g., males and females) What can you tell about the distribution of the participants by looking at the graph (e.g., were there more males than females?) o For each numerical variable, include: The mean and the standard deviation, and the two values between which 68% of the participants fell (=/- 1SD of the mean). The median (middle point of the distribution). . The mode (most frequently occurring value). The range, including the lowest and the highest values. What can you tell about the distribution of the values by looking at the graph (i.e., are the data normally distributed or are they positively or negatively skewed?). Based on the shape of the distribution, is the mean or the median a better measure of central tendency? . Bb Pets fear-seat-grad fetch.content blackboard.co 7 You should submit two documents through Assignment #1" in the "SPSS Assignments" folder on Blackboard: O A pdf file of your Output (with 4 analyses, one for each variable). . You will need to export your Output to a pdf file and save it to your desktop: See "SPSS Exporting Final Output File for Final Submission for instructions on how to do this. You may have to export your output to "Temporary Files" folder to be able to retrieve it. Save your output as "SPSS Assignment #1 _Last Name (replace "Last Name" with your last name. A word document or a pdf of your report (with 4 summaries, one for each variable). . Examples of how to write these summaries are provided below. 2 1 Summary Example 1 (discrete variable): Students enrolled in a college course at a large metropolitan university were asked about their major field of study. Descriptive statistics for college major were calculated. Of the total 132 students who provided information about their college major, 102 (or 77.3%) indicated that psychology was their major and 30 (or 22.7%) indicated a major other than psychology. Looking at the bar graph, it appears thatthe number of students who indicated that psychology was their major was far greater than the number of students who had a major other than psychology. Summary Example 1 (discrete variable): Students enrolled in a college course at a large metropolitan university were asked about their major field of study. Descriptive statistics for college major were calculated. Of the total 132 students who provided information about their college major, 102 (or 77.3%) indicated that psychology was their major and 30 (or 22.7%) indicated a major other than psychology. Looking at the bar graph, it appears thatthe number of students who indicated that psychology was their major was far greater than the number of students who had a major other than psychology. Summary Example 2 (numerical variable): Students enrolled in PSYC 295: Statistical Methods completed an exam at the end of one of four course modules. Descriptive statistics for test scores for 135 students were calculated. The average test score was 77.89 (M = 77.89), and the standard deviation was 11.06 (SD = 11.06). This indicates that 68% of the students had a score that was between 66.83 and 88.98. The middle score was 71.63 (Mdn. - 71.63), indicating that half of the scores were above 71.63 and half were below. The test score of 69.25 was the most frequently occurring score. The range was 60.75, with the lowest score of 38.00 and the highest score of 98.75. Looking at the histogram, it appears that the test score data were negatively skewed, with more students achieving higher test scores. Due to the skewness of the data, the median of 71.63 is likely a moreaccurate measure of central tendency than the mean. Participant Gender Age Test Score 1 2 3 4 5 6 8 9 10 11 12 13 14 15 16 17 18 19 20 Female Male Female Female Male Female Male Male Female Female Male Female Female Female Male Female Male Male Female Female 19 20 19 18 26 19 22 24 19 20 20 21 18 23 21 Class Standing Sophomore Sophomore Junior Sophomore Sophomore Junior Senior Senior Sophomore Freshman Sophomore Junior Freshman Junior Junior Freshman Sophomore Junior Freshman Sophomore 26 34 26 37 32 23 36 34 33 30 36 37 25 38 28 34 30 34 35 32 22 19 20 18 18
Step by Step Solution
There are 3 Steps involved in it

Get step-by-step solutions from verified subject matter experts