

Question: Descriptive Statistics Project Project #1 This project gives you the chance to use all of the statistical techniques and concepts that are covered in the
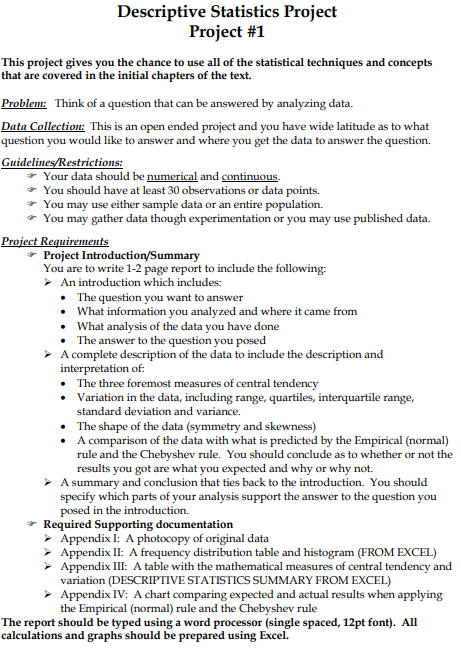
Descriptive Statistics Project Project #1 This project gives you the chance to use all of the statistical techniques and concepts that are covered in the initial chapters of the text. Problem: Think of a question that can be answered by analvzing data. Data Collection: This 15 an open ended project and you have wide latitude as to what question you would like to answer and where you get the data to answer the question. Guidelines/Restrictions: # Your data should be numerical and contimaous. # You should have at least 30 observations or data points. # You may use erther sample data or an entire population. # You may gather data though experimentation or vou may use published data. Project Requirements # Project Introduction/S: You are to write 1-2 pagre report to include the following: An introduction which includes: + The question you want to answer * What information vou analyzed and where it came from * What analysis of the data you have done * The answer to the queshion you posed F A complete description of the data to include the description and interpretation of: The three foremost measures of central tendency * Variation in the data, including range, quartiles, interquarhile range, standard deviation and variance. + The shape of the data (symmetry and skewness) + A comparison of the data with what is predicted by the Empirical (normal) rule and the Chebyshev rule. You should conclude as to whether or not the results you got are what you expected and why or why not. F A summary and conclosion that ties back to the introduction. You should specify which parts of your analysis support the answer to the gquestion you posed in the introduction. # Required Supporting documentation F Appendix I: A photocopy of original data F Appendix I A frequency distribution table and histogram (FROM EXCEL) Appendix [II: A table with the mathematical measures of central tendency and variation (DESCRIPTIVE STATISTICS SUMMARY FROM EXCEL) F Appendix IV: A chart comparing expected and actual results when applying the Empirical (normal) rule and the Chebyshev rule The report should be typed using a word processor (single spaced, 12pt font). All caleulations and graphs should be prepared using Excel
Step by Step Solution
There are 3 Steps involved in it

Get step-by-step solutions from verified subject matter experts