

Question: Descriptive Statistics: Test 1 Average Variable N N* Mean SE Mean StDev Minimum Q1 Median Q3 Maximim Test 1 Average 77 D 86.34 1. 77
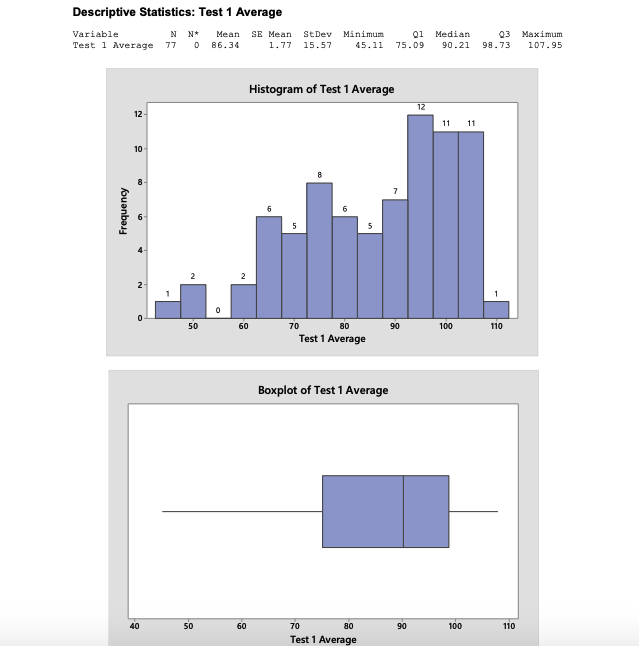
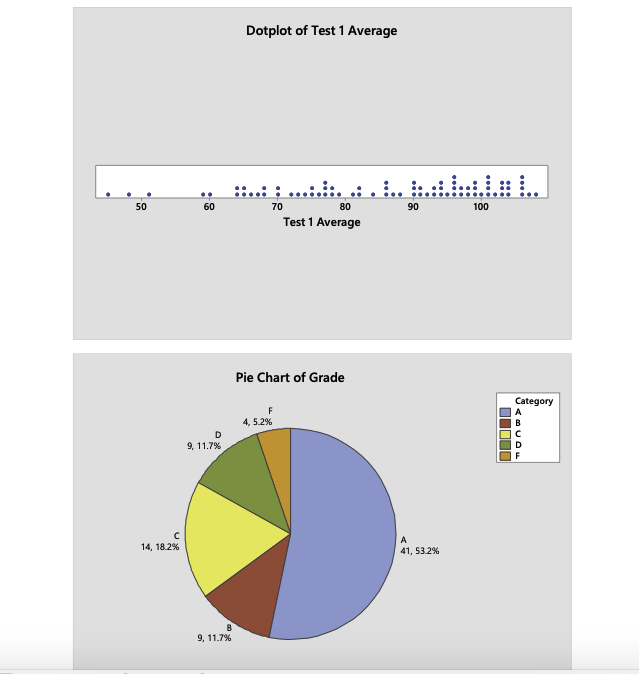
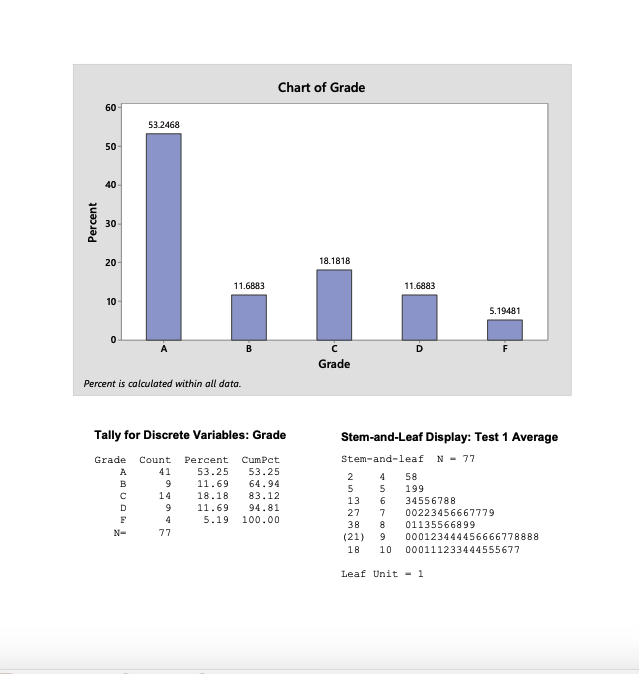
Descriptive Statistics: Test 1 Average Variable N N* Mean SE Mean StDev Minimum Q1 Median Q3 Maximim Test 1 Average 77 D 86.34 1. 77 15.57 45.11 75.09 90 . 21 98 . 73 107.95 Histogram of Test 1 Average 12 12 11 11 10 6 Frequency 2 2 50 60 70 80 90 10 0 110 Test 1 Average Boxplot of Test 1 Average 40 50 60 70 80 90 10 0 110 Test 1 AverageDotplot of Test 1 Average ... 50 60 70 80 90 100 Test 1 Average Pie Chart of Grade Category 4. 5.2% D 9, 11.7% C 14, 18 2% A 41, 53.2% B 9, 11.7%Chart of Grade 60 53.2468 50 Percent 30 20 18.1818 11.6883 11 6883 10 5.19481 A B C D Grade Percent is calculated within all data. Tally for Discrete Variables: Grade Stem-and-Leaf Display: Test 1 Average Grade Count Percent CumPct Stem-and-leaf N = 77 A 41 53.25 53.25 B 9 11 . 69 64 .94 4 58 199 14 18 .18 83.12 34556788 11 . 69 94 . 81 13 27 00223456667779 5.19 100.00 N = 38 01135566899 7 7 (21) 9 000123444456666778888 18 10 000111233444555677 Leaf Unit - 1
Step by Step Solution
There are 3 Steps involved in it

Get step-by-step solutions from verified subject matter experts