

Question: Descriptives Hours Worked Per Week 95% Confidence Interval for Mean N Mean Std. Deviation Std. Error Lower Bound Upper Bound Minimum Maximum Treatment as Usual
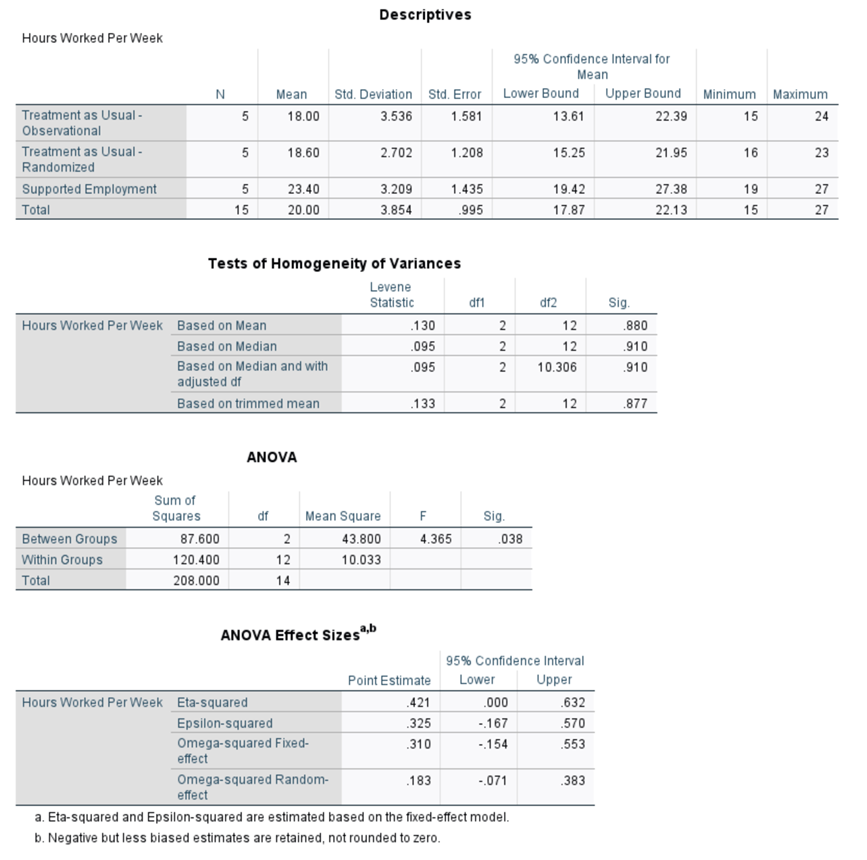
Descriptives Hours Worked Per Week 95% Confidence Interval for Mean N Mean Std. Deviation Std. Error Lower Bound Upper Bound Minimum Maximum Treatment as Usual - 5 18.00 3.536 1.581 13.61 22.39 15 24 Observationa Treatment as Usual- 5 18.60 2.702 1.208 15.25 21.95 16 23 Randomized Supported Employment 5 23.40 3.209 1.435 19.42 27.38 19 27 Total 15 20.00 3.854 995 17.87 22.13 15 27 Tests of Homogeneity of Variances Levene Statistic df1 df2 Sig Hours Worked Per Week Based on Mean 130 12 880 Based on Median 095 NNN 12 910 Based on Median and with 095 10.306 910 adjusted df Based on trimmed mean 133 2 12 877 ANOVA Hours Worked Per Week Sum of Squares df Mean Square F Sig. Between Groups 87.600 2 43.800 4.365 038 Within Groups 120.400 12 10.033 Total 208.000 14 ANOVA Effect Sizesab 95% Confidence Interval Point Estimate Lower Upper Hours Worked Per Week Eta-squared 421 000 632 Epsilon-squared 325 .167 570 Omega-squared Fixed- 310 -.154 553 effect Omega-squared Random- 183 .071 383 effect a. Eta-squared and Epsilon-squared are estimated based on the fixed-effect model. b. Negative but less biased estimates are retained, not rounded to zero
Step by Step Solution
There are 3 Steps involved in it

Get step-by-step solutions from verified subject matter experts