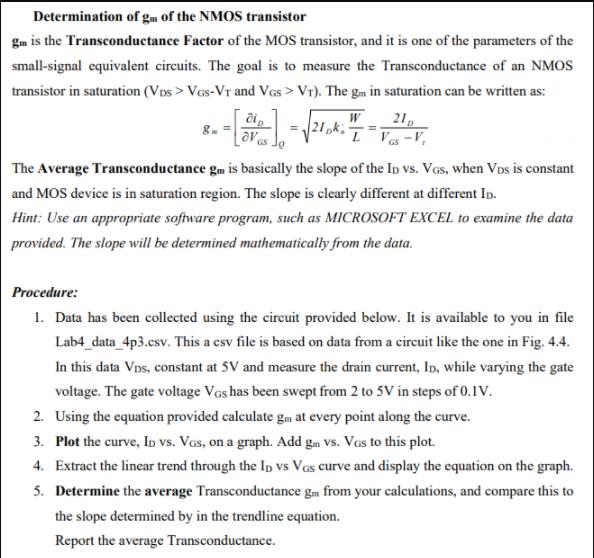
Determination of gm of the NMOS transistor gm is the Transconductance Factor of the MOS transistor,...
Fantastic news! We've Found the answer you've been seeking!
Question:
Transcribed Image Text:
Determination of gm of the NMOS transistor gm is the Transconductance Factor of the MOS transistor, and it is one of the parameters of the small-signal equivalent circuits. The goal is to measure the Transconductance of an NMOS transistor in saturation (VDs > VGS-VT and VGs > VT). The gm in saturation can be written as: -- [ 8 GS JO √21pk. W L 21p Vas-V The Average Transconductance gm is basically the slope of the ID vs. VGS, when VDs is constant and MOS device is in saturation region. The slope is clearly different at different In. Hint: Use an appropriate software program, such as MICROSOFT EXCEL to examine the data provided. The slope will be determined mathematically from the data. Procedure: 1. Data has been collected using the circuit provided below. It is available to you in file Lab4_data_4p3.csv. This a csv file is based on data from a circuit like the one in Fig. 4.4. In this data VDs, constant at 5V and measure the drain current, In, while varying the gate voltage. The gate voltage VGs has been swept from 2 to 5V in steps of 0.1V. 2. Using the equation provided calculate gm at every point along the curve. 3. Plot the curve, ID vs. VGs, on a graph. Add gm vs. Vas to this plot. 5. 4. Extract the linear trend through the ID vs VGs curve and display the equation on the graph. Determine the average Transconductance gm from your calculations, and compare this to the slope determined by in the trendline equation. Report the average Transconductance. 1μF 14 VGS DO 3 ID 4 5 Ammeter DC DS VGSM VDS[MV] I(VGS)[A] 2.00E+00 5.00E+00 6.60E-05 2.10E+00 5.00E+00 9.50E-05 2.20E+00 5.00E+00 1.29E-04 2.30E+00 5.00E+00 1.69E-04 2.40E+00 5.00E+00 2.14E-04 2.50E+00 5.00E+00 2.64E-04 2.60E+00 5.00E+00 3.19E-04 2.70E+00 5.00E+00 3.80E-04 2.80E+00 5.00E+00 4.46E-04 2.90E+00 5.00E+00 5.17E-04 3.00E+00 5.00E+00 5.94E-04 3.10E+00 5.00E+00 6.76E-04 3.20E+00 5.00E+00 7.63E-04 3.30E+00 5.00E+00 8.55E-04 3.40E+00 5.00E+00 9.53E-04 3.50E+00 5.00E+00 1.06E-03 3.60E+00 5.00E+00 1.16E-03 3.70E+00 5.00E+00 1.28E-03 3.80E+00 5.00E+00 1.40E-03 3.90E+00 5.00E+00 1.52E-03 4.00E+00 5.00E+00 1.65E-03 4.10E+00 5.00E+00 1.78E-03 4.20E+00 5.00E+00 1.92E-03 4.30E+00 5.00E+00 2.07E-03 4.40E+00 5.00E+00 2.22E-03 4.50E+00 5.00E+00 2.38E-03 4.60E+00 5.00E+00 2.54E-03 4.70E+00 5.00E+00 2.70E-03 4.80E+00 5.00E+00 2.87E-03 4.90E+00 5.00E+00 3.05E-03 5.00E+00 5.00E+00 3.23E-03 Determination of gm of the NMOS transistor gm is the Transconductance Factor of the MOS transistor, and it is one of the parameters of the small-signal equivalent circuits. The goal is to measure the Transconductance of an NMOS transistor in saturation (VDs > VGS-VT and VGs > VT). The gm in saturation can be written as: -- [ 8 GS JO √21pk. W L 21p Vas-V The Average Transconductance gm is basically the slope of the ID vs. VGS, when VDs is constant and MOS device is in saturation region. The slope is clearly different at different In. Hint: Use an appropriate software program, such as MICROSOFT EXCEL to examine the data provided. The slope will be determined mathematically from the data. Procedure: 1. Data has been collected using the circuit provided below. It is available to you in file Lab4_data_4p3.csv. This a csv file is based on data from a circuit like the one in Fig. 4.4. In this data VDs, constant at 5V and measure the drain current, In, while varying the gate voltage. The gate voltage VGs has been swept from 2 to 5V in steps of 0.1V. 2. Using the equation provided calculate gm at every point along the curve. 3. Plot the curve, ID vs. VGs, on a graph. Add gm vs. Vas to this plot. 5. 4. Extract the linear trend through the ID vs VGs curve and display the equation on the graph. Determine the average Transconductance gm from your calculations, and compare this to the slope determined by in the trendline equation. Report the average Transconductance. 1μF 14 VGS DO 3 ID 4 5 Ammeter DC DS VGSM VDS[MV] I(VGS)[A] 2.00E+00 5.00E+00 6.60E-05 2.10E+00 5.00E+00 9.50E-05 2.20E+00 5.00E+00 1.29E-04 2.30E+00 5.00E+00 1.69E-04 2.40E+00 5.00E+00 2.14E-04 2.50E+00 5.00E+00 2.64E-04 2.60E+00 5.00E+00 3.19E-04 2.70E+00 5.00E+00 3.80E-04 2.80E+00 5.00E+00 4.46E-04 2.90E+00 5.00E+00 5.17E-04 3.00E+00 5.00E+00 5.94E-04 3.10E+00 5.00E+00 6.76E-04 3.20E+00 5.00E+00 7.63E-04 3.30E+00 5.00E+00 8.55E-04 3.40E+00 5.00E+00 9.53E-04 3.50E+00 5.00E+00 1.06E-03 3.60E+00 5.00E+00 1.16E-03 3.70E+00 5.00E+00 1.28E-03 3.80E+00 5.00E+00 1.40E-03 3.90E+00 5.00E+00 1.52E-03 4.00E+00 5.00E+00 1.65E-03 4.10E+00 5.00E+00 1.78E-03 4.20E+00 5.00E+00 1.92E-03 4.30E+00 5.00E+00 2.07E-03 4.40E+00 5.00E+00 2.22E-03 4.50E+00 5.00E+00 2.38E-03 4.60E+00 5.00E+00 2.54E-03 4.70E+00 5.00E+00 2.70E-03 4.80E+00 5.00E+00 2.87E-03 4.90E+00 5.00E+00 3.05E-03 5.00E+00 5.00E+00 3.23E-03
Expert Answer:
Answer rating: 100% (QA)
The image you sent shows the determination of the transconductance factor gm of an NMOS transistor T... View the full answer
Related Book For
Posted Date:
Students also viewed these accounting questions
-
A one-sided confidence interval for p can be written as p < + E or p > - E, where the margin of error E is modified by replacing z/2 with z. If Air Borealis wants to report an on-time performance of...
-
The interval (2, 5) can be written as the inequality _________.
-
(a) Show that Eq. (1630) can be written as (b) Use the binomial theorem to show that if v « c, this is approximately equal to fr=fs(1-u/c) -1/2 (c) A pilotless reconnaissance aircraft emits a...
-
What is the driving force for mountain building in the Andes?
-
The operating section of the 2012 consolidated statement of cash flows for Imation Corporation, a global technology company, is excerpted in the following table (dollars in millions): Imation Corp....
-
Complete the level production plan, using the following information. The only costs you need to consider here are layoff, hiring, and inventory costs. If you complete the plan correctly, your hiring,...
-
Evans \& Sons is converting its sales revenues to corresponding cash amounts using the direct method. Sales revenue on the income statement are \(\$ 1,025,000\). Beginning and ending accounts...
-
Authorization of transactions is considered a key control in most organizations. Authorizations should not be made by individuals who have incompatible functions. For each transaction (listed as A....
-
Design decisions are important because they go a long way to determine the actual performance of the process. explain how process tasks and capacity can be configured appropriately? Elaborate your...
-
1. Is Facebook's mission statement market oriented? Explain. 2. How is Facebook's strategy driven by its mission? 3. Is it wise for Facebook to give away it technologies for free? Why or why not? 4....
-
Earnings per share (EPS) for Valcor Inc. are $3 at a sales level of $3 million. If Valcor's degree of operating leverage is 1.5 and its degree of combined leverage is 3.0, what will happen to EPS if...
-
You are selling your product at a three-day event. Each day, there is a 60% chance that you will make money. What is the probability that you will make money all three days?
-
Discuss what t-tests are. Explain the difference between one and two-tailed t-tests. Explain the usefulness of t-test findings for statistical analysis. what is a data set and perform a t-test...
-
x y Prove that in the case of simple linear regression with a sample (xi, Yi), i = 1,...,n, the lest squares line always passes through the point (,), where x = n1 and = n-119
-
A firm expects to sell 25,000 units of its product at $11 per unit.Net income before tax is predicted to be $60,000.If the variable costs per unit are $6 per unit, total fixed costs must be: Mar...
-
(i)Identify two objectives of imposing tax penalties (ii)Assess two circumstances under which the imposition of penalties might not achieve the intended objectives
-
The following are the cash flows of two projects: Year Project A Project B O1234 0 $ (350) $ (350) 180 250 180 250 180 250 180 What is the payback period of each project? Note: Round your answers to...
-
The percentage of completion and completed contract methods are described in the FASB ASC. Search the codification to find the paragraphs covering these topics, cite them, and copy the results.
-
A system has a block diagram as shown in Figure P3.26. Determine a state variable model and the state transition matrix Φ(s). R(s) Msi 25 FIGURE P3.26 Feedback system
-
The story is told about the sergeant who stopped at the jewelry store every morning at nine o'clock and compared and reset his watch with the chronometer in the window. Finally, one day the sergeant...
-
Consider a system in state variable form: (a) Compute the characteristic equation using the poly function. (b) Compute the roots of the characteristic equation, and determine whether the system is...
-
Determine the total estimated cost at completion and estimated cost to complete for the project in Problem 12, assuming the CPI remains the same through the remainder of the job. Data From Problem...
-
Determine the total estimated cost at completion and estimated cost to complete for the project in Problem 13, assuming the CPI remains the same through the remainder of the job. Data From Problem...
-
Create a cost-loaded spreadsheet like the one shown in Figure 7-5 . The spreadsheet should handle 12 weeks and 20 tasks. Data From Figure 7-5 Task Mobilization Cost Start Finish Week 1 Week 2 Week 3...
Study smarter with the SolutionInn App