

Question: Determine experimental values for pi by plotting diameter and circumference data sets. Five data sets will be provided. The diameters of various cylinders were measured
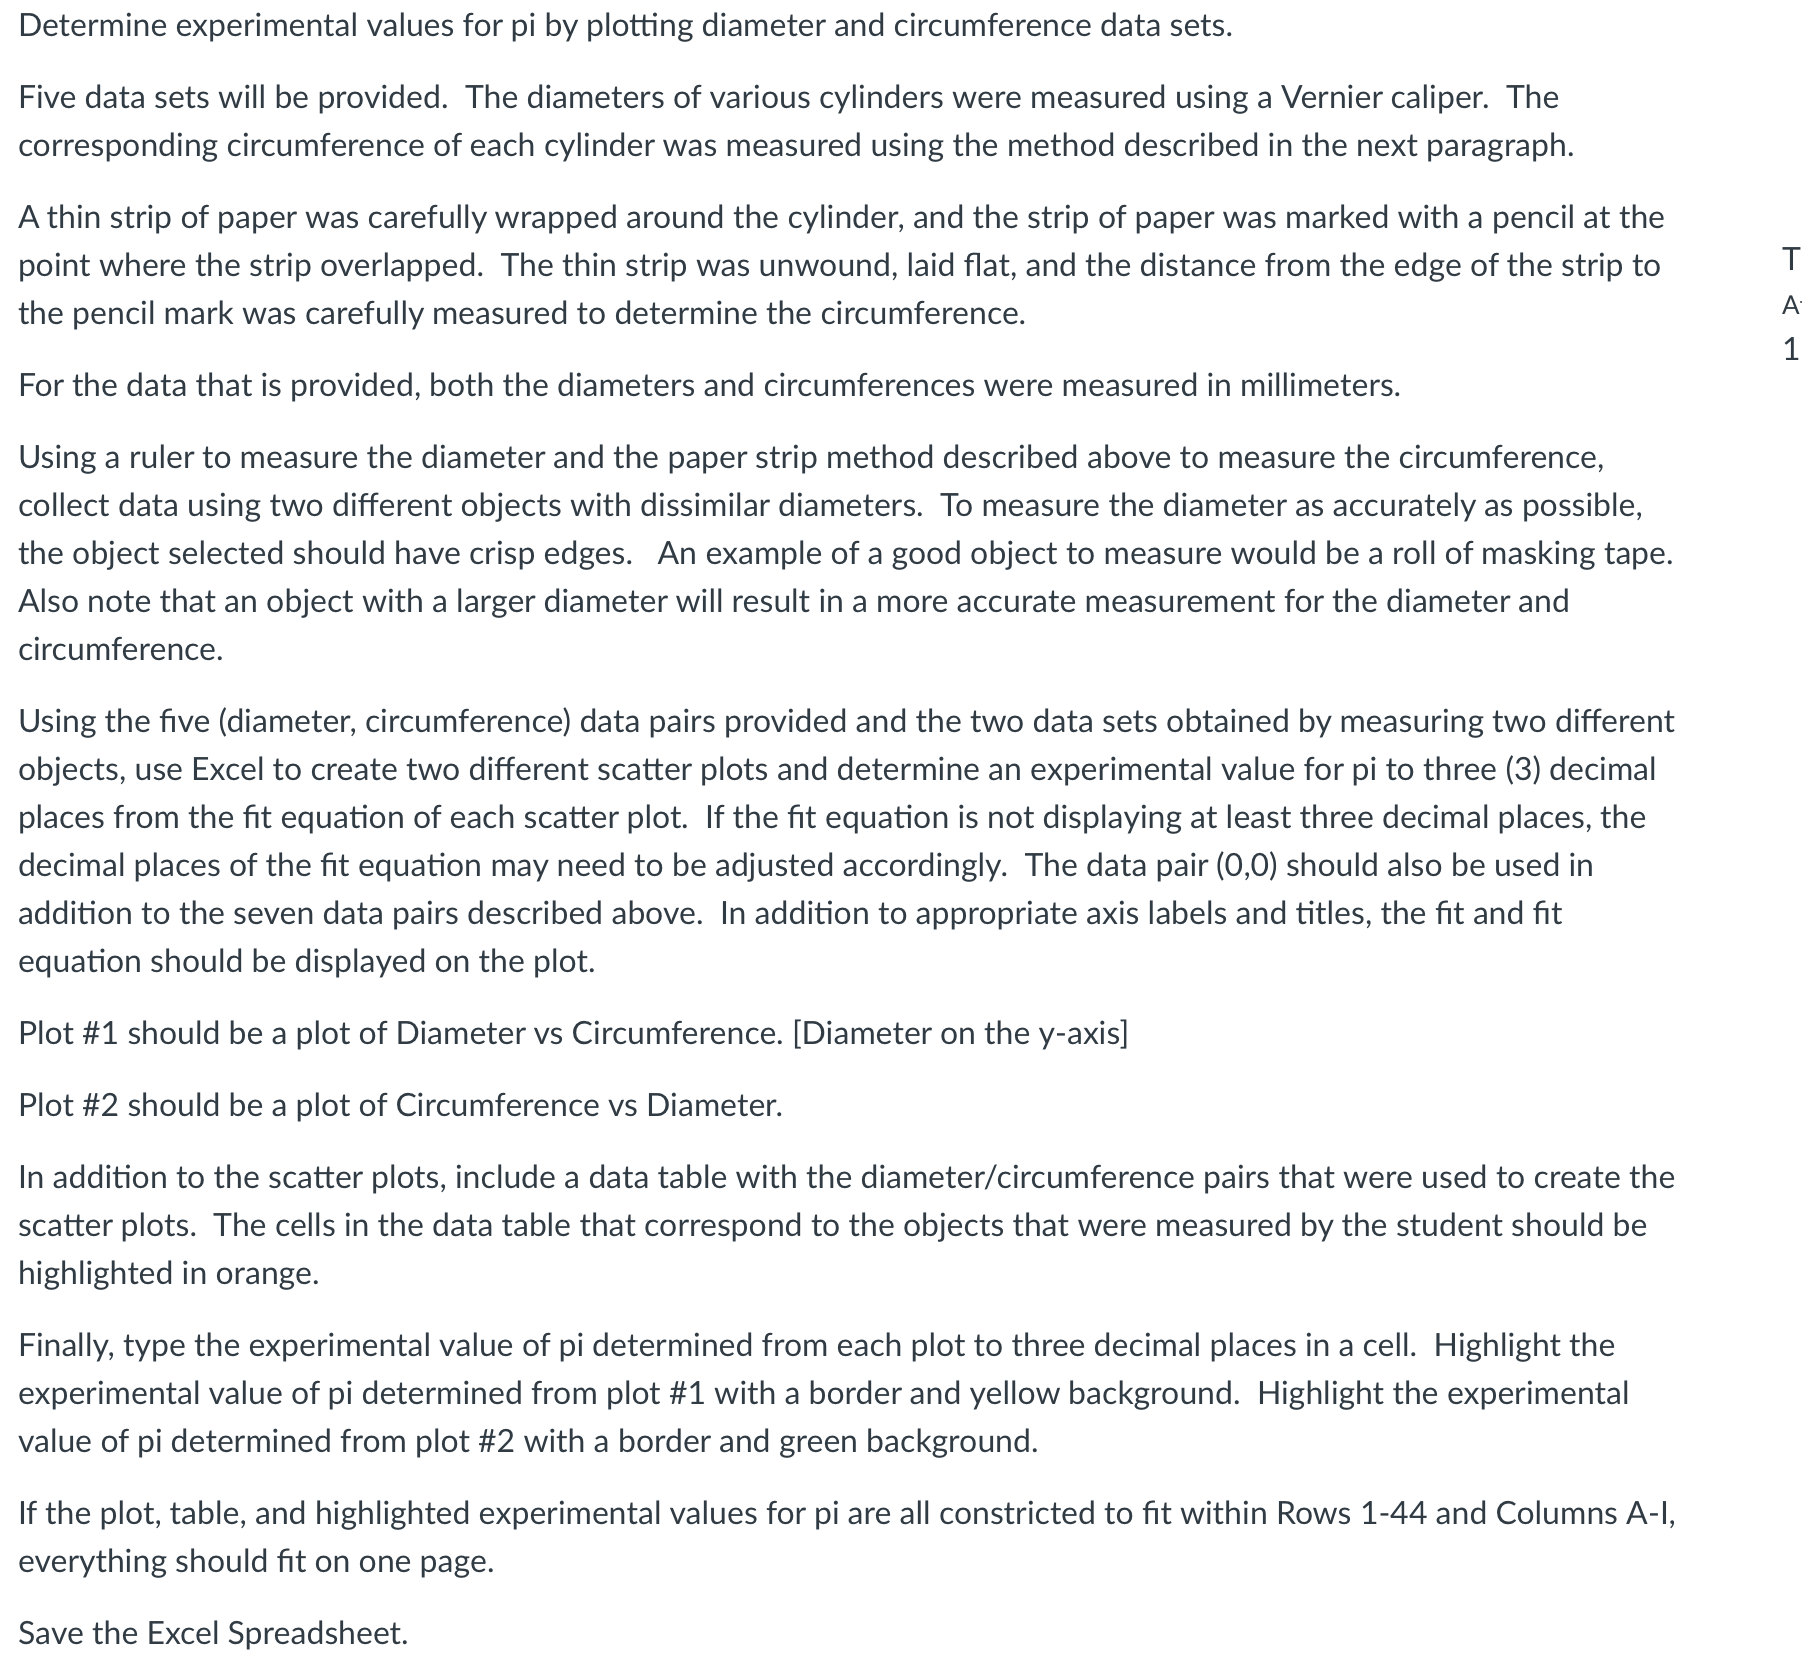
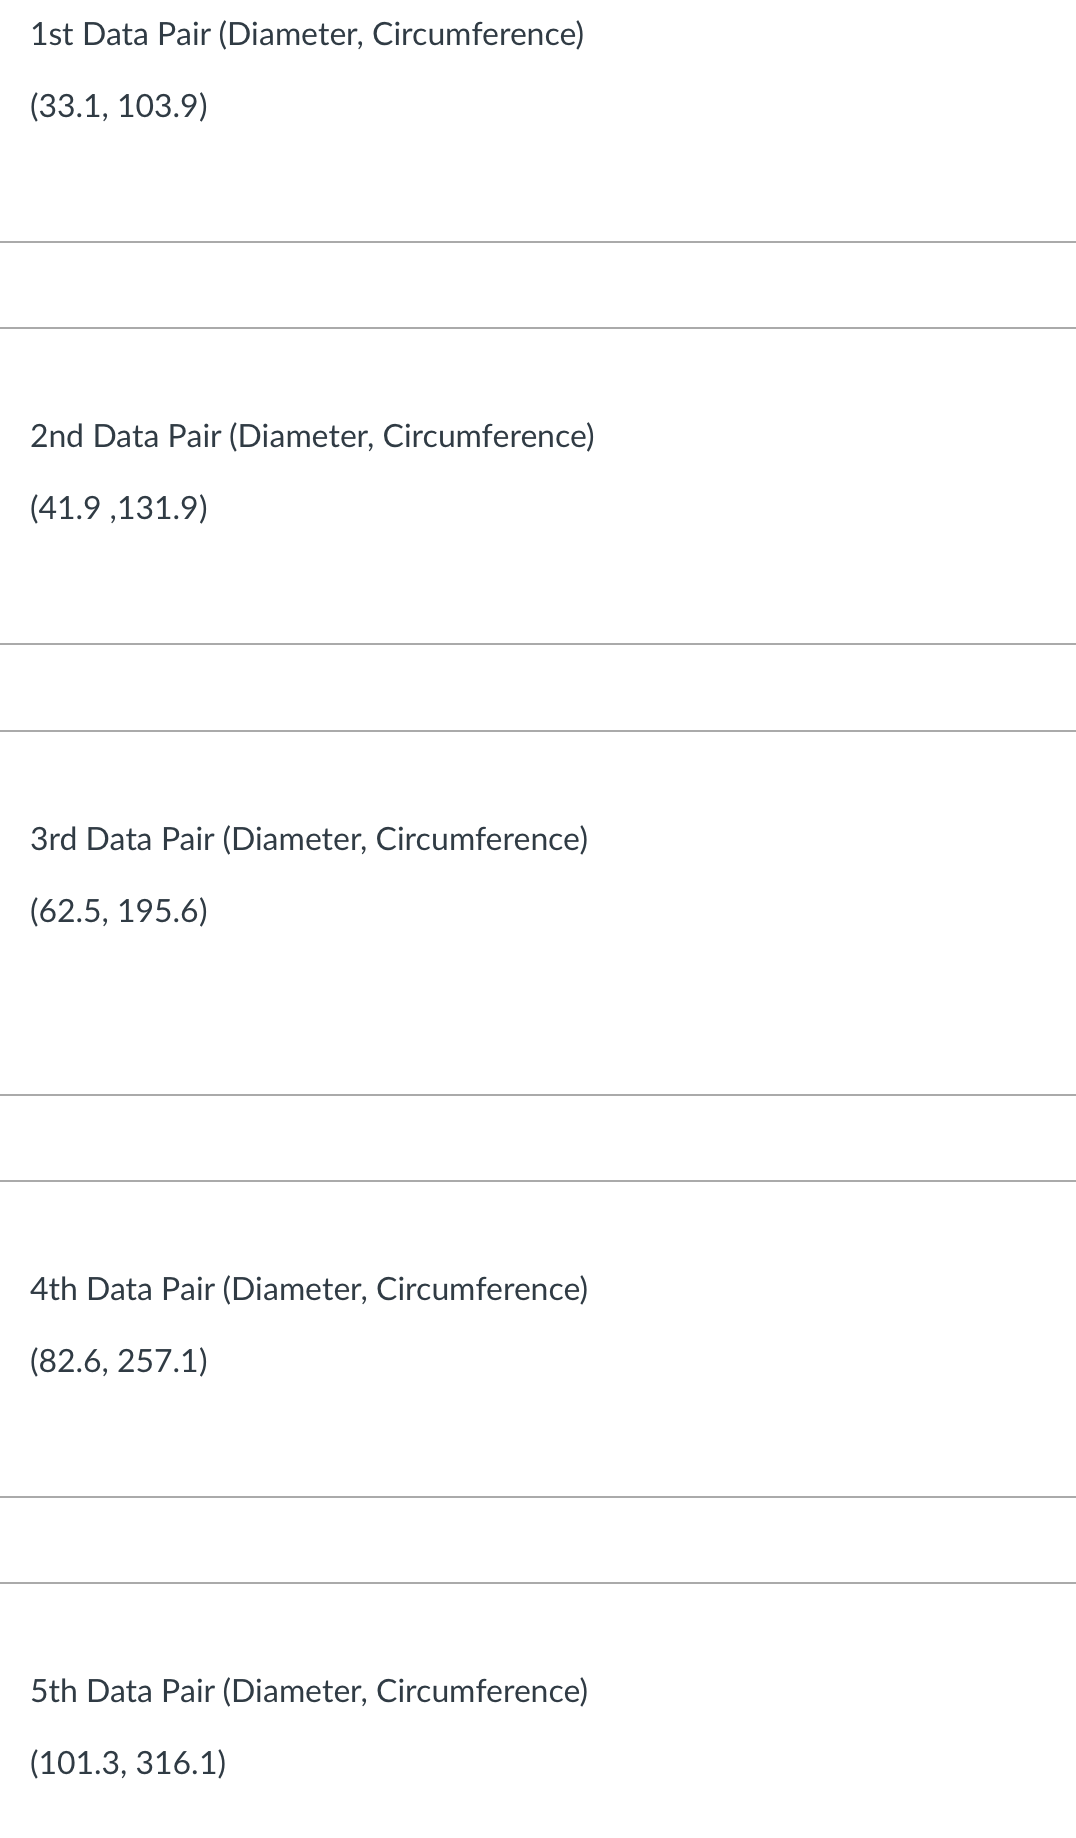
Determine experimental values for pi by plotting diameter and circumference data sets. Five data sets will be provided. The diameters of various cylinders were measured using a Vernier caliper. The corresponding circumference of each cylinder was measured using the method described in the next paragraph. Athin strip of paper was carefully wrapped around the cylinder, and the strip of paper was marked with a pencil at the point where the strip overlapped. The thin strip was unwound, laid at, and the distance from the edge of the strip to the pencil mark was carefully measured to determine the circumference. For the data that is provided, both the diameters and circumferences were measured in millimeters. Using a ruler to measure the diameter and the paper strip method described above to measure the circumference, collect data using two different objects with dissimilar diameters. To measure the diameter as accurately as possible, the object selected should have crisp edges. An example of a good object to measure would be a roll of masking tape. Also note that an object with a larger diameter will result in a more accurate measurement for the diameter and circumference. Using the ve (diameter, circumference) data pairs provided and the two data sets obtained by measuring two different objects, use Excel to create two different scatter plots and determine an experimental value for pi to three (3) decimal places from the t equation of each scatter plot. If the t equation is not displaying at least three decimal places, the decimal places of the t equation may need to be adjusted accordingly. The data pair (0,0) should also be used in addition to the seven data pairs described above. In addition to appropriate axis labels and titles, the t and t equation should be displayed on the plot. Plot #1 should be a plot of Diameter vs Circumference. [Diameter on the y-axis] Plot #2 should be a plot of Circumference vs Diameter. In addition to the scatter plots, include a data table with the diameter/circumference pairs that were used to create the scatter plots. The cells in the data table that correspond to the objects that were measured by the student should be highlighted in orange. Finally, type the experimental value of pi determined from each plot to three decimal places in a cell. Highlight the experimental value of pi determined from plot #1 with a border and yellow background. Highlight the experimental value of pi determined from plot #2 with a border and green background. If the plot, table, and highlighted experimental values for pi are all constricted to t within Rows 1-44 and Columns A-I, everything should t on one page. Save the Excel Spreadsheet. l'J? 1st Data Pair (Diameter, Circumference) (33.1, 103.9) 2nd Data Pair (Diameter, Circumference) (41.9 ,131.9) 3rd Data Pair (Diameter, Circumference) (62.5, 195.6) 4th Data Pair (Diameter, Circumference) (82.6, 257.1) 5th Data Pair (Diameter, Circumference) (101.3, 316.1)
Step by Step Solution
There are 3 Steps involved in it

Get step-by-step solutions from verified subject matter experts