

Question: determine K for each decay (so 4 Ks in total) Figure 5. Exponential decay of the OH LIF signal in 100 Torr N2, at 293K,
determine K for each decay (so 4 Ks in total) 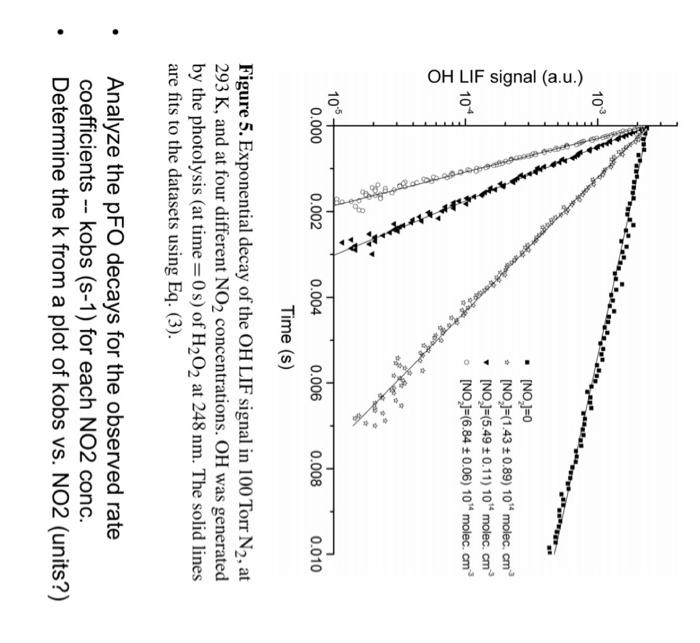
Figure 5. Exponential decay of the OH LIF signal in 100 Torr N2, at 293K, and at four different NO2 concentrations. OH was generated by the photolysis (at time =0s ) of H2O2 at 248nm. The solid lines are fits to the datasets using Eq. (3). Analyze the pFO decays for the observed rate coefficients -- kobs (s-1) for each NO2 conc. Determine the k from a plot of kobs vs. NO2 (units?)
Step by Step Solution
There are 3 Steps involved in it
1 Expert Approved Answer
Step: 1 Unlock

Question Has Been Solved by an Expert!
Get step-by-step solutions from verified subject matter experts
Step: 2 Unlock
Step: 3 Unlock