

Question: Determine the c-chart two-sigma upper and lower control limits for this process. Is the process in statistical control? The UCLc equals (Enter your responses rounded
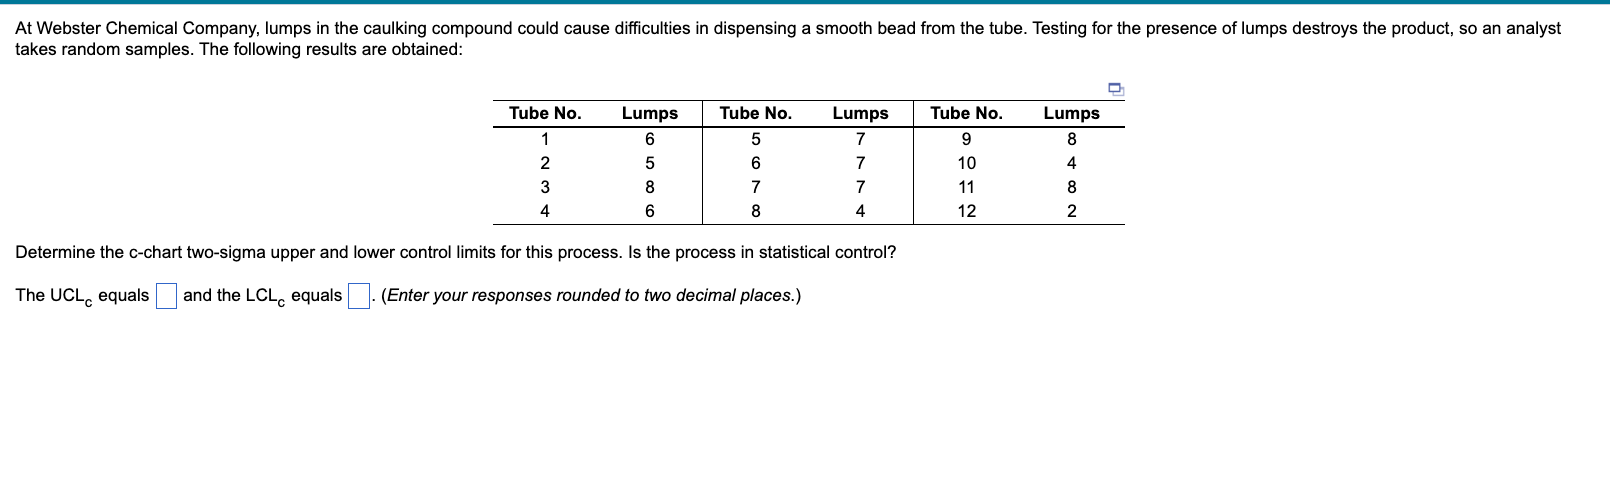
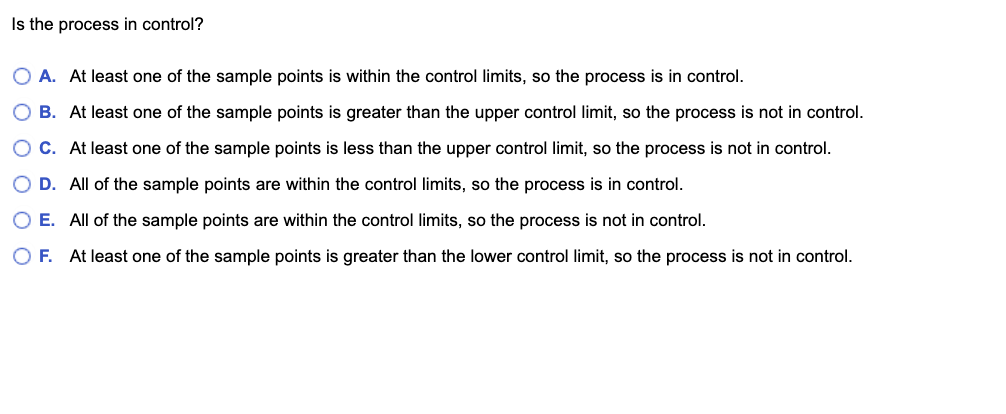
Determine the c-chart two-sigma upper and lower control limits for this process. Is the process in statistical control? The UCLc equals (Enter your responses rounded to two decimal places.) Is the process in control? A. At least one of the sample points is within the control limits, so the process is in control. B. At least one of the sample points is greater than the upper control limit, so the process is not in cont C. At least one of the sample points is less than the upper control limit, so the process is not in control. D. All of the sample points are within the control limits, so the process is in control. E. All of the sample points are within the control limits, so the process is not in control. F. At least one of the sample points is greater than the lower control limit, so the process is not in contro
Step by Step Solution
There are 3 Steps involved in it

Get step-by-step solutions from verified subject matter experts