

Question: Determine the classes. a) Find the highest and lowest values. b) Find the range. c) Select the number of classes desired. d) Find the
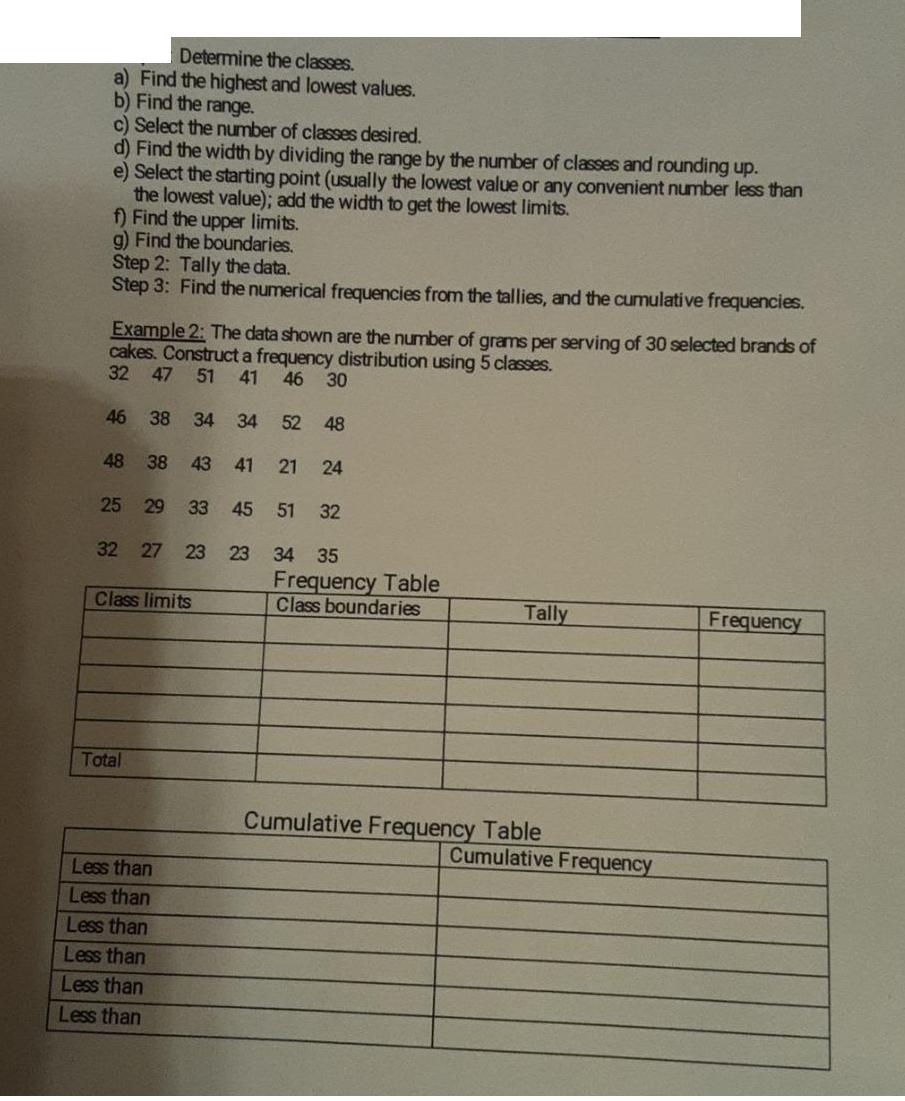
Determine the classes. a) Find the highest and lowest values. b) Find the range. c) Select the number of classes desired. d) Find the width by dividing the range by the number of classes and rounding up. e) Select the starting point (usually the lowest value or any convenient number less than the lowest value); add the width to get the lowest limits. f) Find the upper limits. g) Find the boundaries. Step 2: Tally the data. Step 3: Find the numerical frequencies from the tallies, and the cumulative frequencies. Example 2: The data shown are the number of grams per serving of 30 selected brands of cakes. Construct a frequency distribution using 5 classes. 32 47 51 41 46 30 46 38 34 34 52 48 48 38 43 41 21 24 25 29 33 45 51 32 32 27 23 23 34 35 Class limits Total Less than Less than Less than Less than Less than Less than Frequency Table Class boundaries Tally Cumulative Frequency Table Cumulative Frequency Frequency
Step by Step Solution
There are 3 Steps involved in it

Get step-by-step solutions from verified subject matter experts