

Question: Determine whether the graph can represent a normal curve. If it cannot, explain why. O A. The graph cannot represent a normal density function
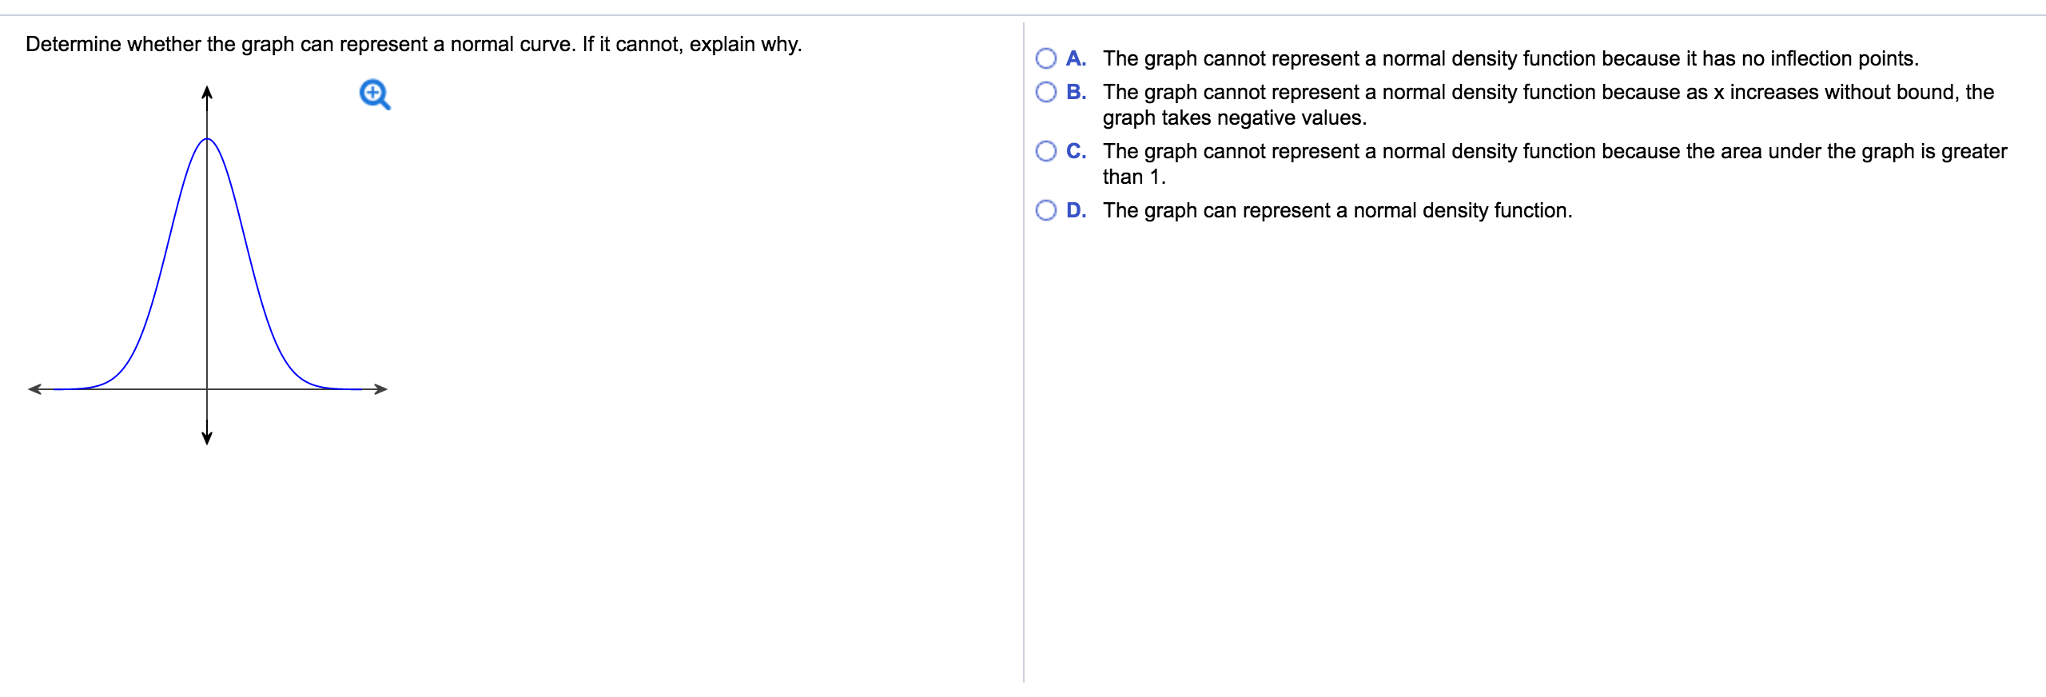
Determine whether the graph can represent a normal curve. If it cannot, explain why. O A. The graph cannot represent a normal density function because it has no inflection points. B. The graph cannot represent a normal density function because as x increases without bound, the graph takes negative values. C. The graph cannot represent a normal density function because the area under the graph is greater than 1. D. The graph can represent a normal density function.
Step by Step Solution
★★★★★
3.43 Rating (162 Votes )
There are 3 Steps involved in it
1 Expert Approved Answer
Step: 1 Unlock

Question Has Been Solved by an Expert!
Get step-by-step solutions from verified subject matter experts
Step: 2 Unlock
Step: 3 Unlock