

Question: Determine whether the graph can represent a Normal density function or explain why it cannot Choose the correct answer below OA Yes OB No because
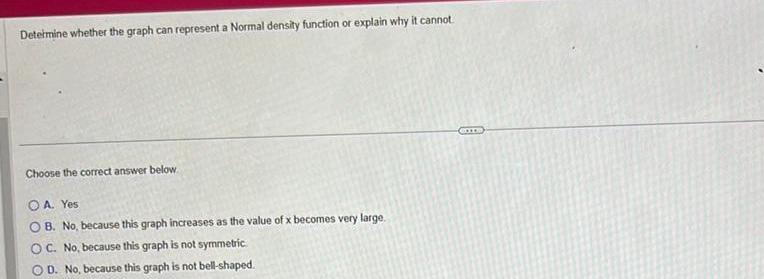

Determine whether the graph can represent a Normal density function or explain why it cannot Choose the correct answer below OA Yes OB No because this graph increases as the value of x becomes very large OC No because this graph is not symmetric D No because this graph is not bell shaped CITS
Step by Step Solution
There are 3 Steps involved in it
1 Expert Approved Answer
Step: 1 Unlock

Question Has Been Solved by an Expert!
Get step-by-step solutions from verified subject matter experts
Step: 2 Unlock
Step: 3 Unlock