

Question: Determine whether the graph shown could represent a variable with a normal distribution Explain your reasoning If the graph appears to represent a normal distribution
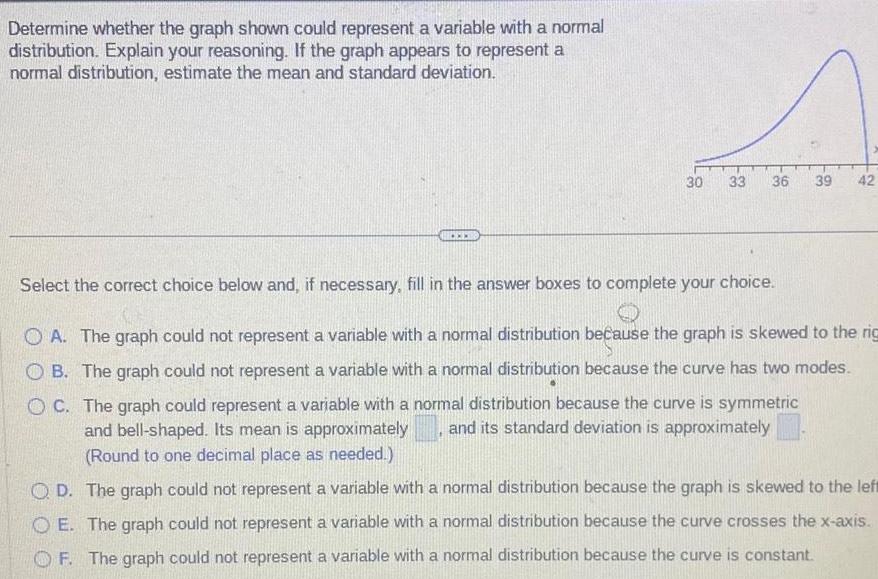

Determine whether the graph shown could represent a variable with a normal distribution Explain your reasoning If the graph appears to represent a normal distribution estimate the mean and standard deviation xx 30 33 36 39 42 Select the correct choice below and if necessary fill in the answer boxes to complete your choice OA The graph could not represent a variable with a normal distribution because the graph is skewed to the rig OB The graph could not represent a variable with a normal distribution because the curve has two modes OC The graph could represent a variable with a normal distribution because the curve is symmetric and its standard deviation is approximately and bell shaped Its mean is approximately Round to one decimal place as needed QD The graph could not represent a variable with a normal distribution because the graph is skewed to the left OE The graph could not represent a variable with a normal distribution because the curve crosses the x axis OF The graph could not represent a variable with a normal distribution because the curve is constant
Step by Step Solution
There are 3 Steps involved in it

Get step-by-step solutions from verified subject matter experts