

Question: answer please Determine whether the following graph can represent a variable with a normal distribution. Explain your reasoning. If the graph appears to represent a
answer please
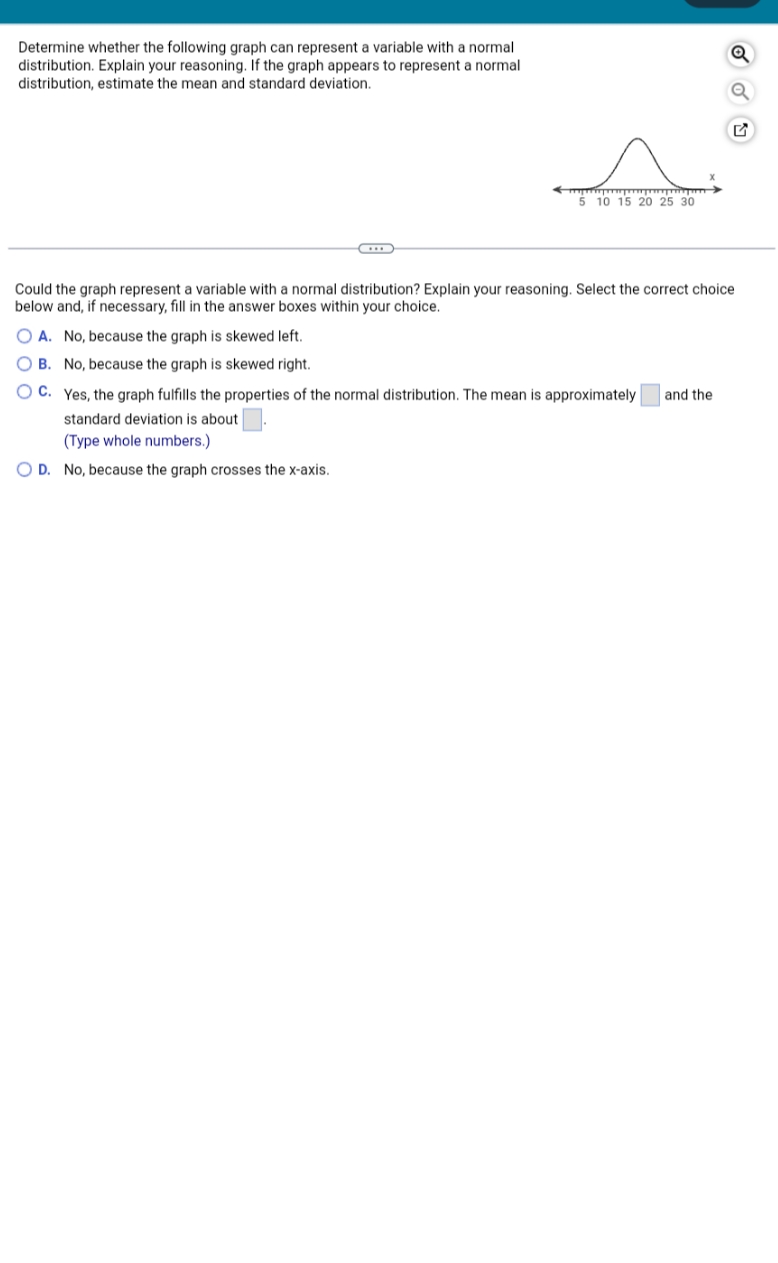
Determine whether the following graph can represent a variable with a normal distribution. Explain your reasoning. If the graph appears to represent a normal distribution. estimate the mean and standard deviation. )0}? 5 \"211520 25 30 (1) Could the graph represent a variable with a normal distribution? Explain your reasoning. Select the correct choice below and. if necessary. ll in the answer boxes within your choice. O A. No, because the graph is skewed left. O B. No, because the graph is skewed right. if} 0- Yes. the graph fulfills the properties of the normal distribution. The mean Is approximately : and the standard deviation is about | |. (Type whole numbers.) ii) D. NO. because the graph crosses the ll'llis
Step by Step Solution
There are 3 Steps involved in it

Get step-by-step solutions from verified subject matter experts