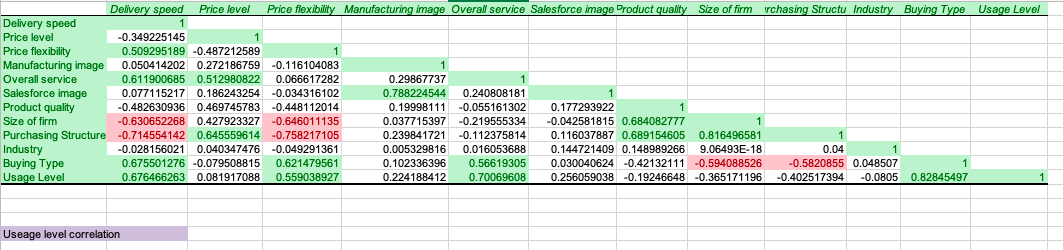
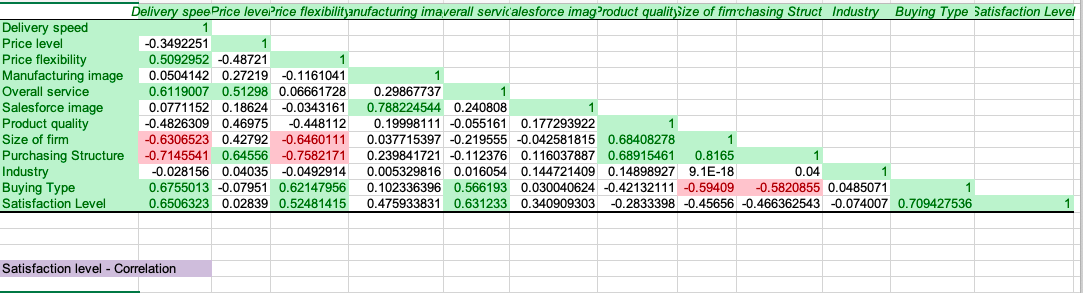
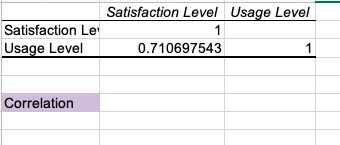
Question: Develop a cause-and-effect model that can provide insights about the drivers of satisfaction and usage level. Delivery speed Price level Price flexibility Manufacturing image Overall

Develop a cause-and-effect model that can provideDevelop a cause-and-effect model that can provideDevelop a cause-and-effect model that can provide

  1. Develop a cause-and-effect model that can provide insights about the drivers of satisfaction and usage level.
Delivery speed Price level Price flexibility Manufacturing image Overall service Salesforce image Product quality Size of firm rchasing Structu Industry Buying Type Usage Level Delivery speed 1 Price level -0.349225145 1 Price flexibility 0.509295189 -0.487212589 1 Manufacturing image 0.050414202 0.272186759 -0.116104083 1 Overall service 0.611900685 0.512980822 0.066617282 0.29867737 1 Salesforce image 0.077115217 0.186243254 -0.034316102 0.788224544 0.240808181 1 Product quality -0.482630936 0.469745783 -0.448112014 0.19998111 -0.055161302 0.177293922 1 Size of firm -0.630652268 0.427923327 -0.646011135 0.037715397 -0.219555334 -0.042581815 0.684082777 1 Purchasing Structure -0.714554142 0.645559614 -0.758217105 0.239841721 -0.112375814 0.116037887 0.689154605 0.816496581 1 Industry -0.028156021 0.040347476 -0.049291361 0.005329816 0.016053688 0.144721409 0.148989266 9.06493E-18 0.04 1 Buying Type 0.675501276 -0.079508815 0.621479561 0.102336396 0.56619305 0.030040624 -0.42132111 -0.594088526 -0.5820855 0.048507 1 Usage Level 0.676466263 0.081917088 0.559038927 0.224188412 0.70069608 0.256059038 -0.19246648 -0.365171196 -0.402517394 -0.0805 0.82845497 Useage level correlation Delivery speePrice levePrice flexibilityanufacturing imaverall servic'alesforce imagProduct qualitySize of fimchasing Struct Industry Buying Type Satisfaction Level Delivery speed Price level Price flexibility Manufacturing image Overall service Sales Salesforce image des Product quality Size of fimm Purchasing Structure Industry Buying Type Satisfaction Level -0.3492251 0.5092952 -0.48721 0.0504142 0.27219 -0.1161041 0.6119007 0.51298 0.06661728 0.0771152 0.18624 -0.0343161 2006 -0.4826309 0.46975 -0.448112 -0.6306523 0.42792 -0.6460111 a50 2070 -0.7145541 0.64556 -0.7582171 BARE -0.028156 0.04035 -0.0492914 0.6755013 -0.07951 0.62147956 0.6506323 0.02839 0.52481415 0.29867737 0.788224544 0.240808 0.19998111 -0.055161 0.177293922 0.037715397 -0.219555 -0.042581815 0.68408278 1 0.239841721 -0.112376 0.116037887 0.68915461 0.8165 0.005329816 0.016054 0.144721409 0.14898927 9.1E-18 0.04 0.102336396 0.566193 0.030040624 -0.42132111 -0.59409 -0.5820855 0.0485071 0.475933831 0.631233 0.340909303 -0.2833398 -0.45656 -0.466362543 -0.074007 0.709427536 Satisfaction level - Correlation Satisfaction Le Usage Level Satisfaction Level Usage Level 1 0.710697543 1 Correlation

Step by Step Solution

There are 3 Steps involved in it

1 Expert Approved Answer
Step: 1 Unlock blur-text-image
Question Has Been Solved by an Expert!

Get step-by-step solutions from verified subject matter experts

Step: 2 Unlock
Step: 3 Unlock

Students Have Also Explored These Related General Management Questions!