

Question: Develop a cause-and-effect model that can provide insights about the drivers of satisfaction and usage level. **Photos are clearer when you zoom in** G Manufacturing
- Develop a cause-and-effect model that can provide insights about the drivers of satisfaction and usage level.
**Photos are clearer when you zoom in**
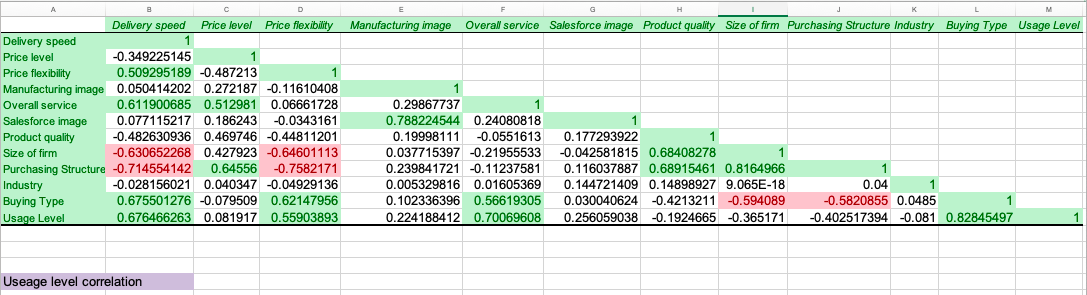
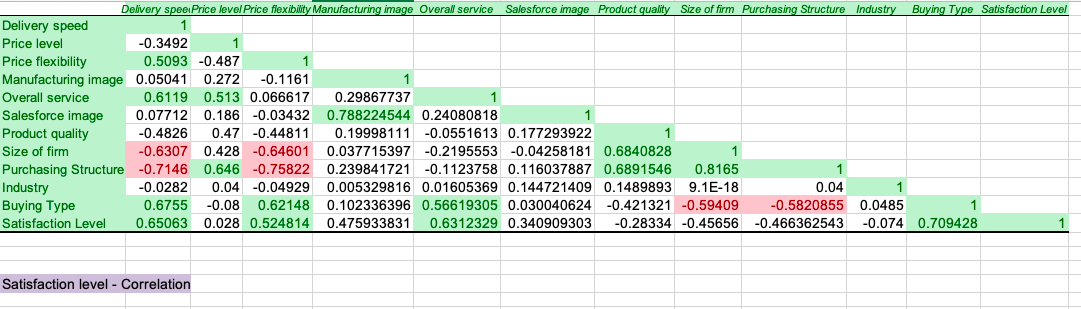
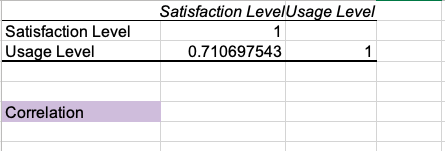
G Manufacturing image Overall service Salesforce image Product quality Size of firm Purchasing Structure Industry Buying Type Usage Level Delivery speed Price level Price flexibility Delivery speed Price level -0.349225145 Price flexibility 0.509295189 -0.487213 Manufacturing image 0. 0.050414202 0.272187 -0.11610408 Overall service 0.611900685 0.512981 0.06661728 Salesforce image 0.077115217 0.186243 -0.0343161 -0.482630936 0.469746 -0.44811201 Size of firm -0.630652268 0.427923 -0.64601113 Purchasing Structure -0.714554142 0.64556 -0.7582171 -0.028156021 0.040347 -0.04929136 Buying Type 0.675501276 -0.079509 0.62147956 Usage Level 0.676466263 0.081917 0.55903893 Product quality 0.29867737 0.788224544 0.24080818 0.19998111 -0.0551613 0.037715397 -0.21955533 0.239841721 -0.11237581 0.005329816 0.01605369 0.102336396 0.56619305 0.224188412 0.70069608 Industry 0.177293922 -0.042581815 0.68408278 0.116037887 0.68915461 0.8164966 0.144721409 0.14898927 9.065E-18 0.030040624 -0.4213211 -0.594089 0.256059038 -0.1924665 -0.365171 0.04 -0.5820855 0.0485 -0.402517394 -0.081 0.82845497 1 Useage level correlation Delivery spees Price level Price flexibility Manufacturing image Overall service Salesforce image Product quality Size of firm Purchasing Structure Industry Buying Type Satisfaction Level Delivery speed Price level -0.3492 1 Price flexibility 0.5093 -0.487 Manufacturing image 0.05041 0.272 -0.1161 Overall service 0.6119 0.513 0.066617 0.29867737 Salesforce image 0.07712 0.186 -0.03432 0.788224544 0.24080818 Product quality -0.4826 0.47 -0.44811 0.19998111 -0.0551613 0.177293922 Size of firm -0.6307 0.428 -0.64601 0.037715397 -0.2195553 -0.04258181 0.6840828 1 Purchasing Structure -0.7146 0.646 -0.75822 0.239841721 -0.1123758 0.116037887 0.6891546 0.8165 -0.0282 0.04 -0.04929 0.005329816 0.01605369 0.144721409 0.1489893 9.1E-18 0.04 1 Buying Type 0.6755 -0.08 0.62148 0.102336396 0.56619305 0.030040624 -0.421321 -0.59409 -0.5820855 0.0485 1 Satisfaction Level 0.65063 0.028 0.524814 0.475933831 0.6312329 0.340909303 -0.28334 -0.45656 -0.466362543 -0.074 0.709428 Industry Satisfaction level - Correlation Satisfaction Level Usage Level Satisfaction LevelUsage Level 1 0.710697543 1 CorrelationStep by Step Solution
There are 3 Steps involved in it
1 Expert Approved Answer
Step: 1 Unlock

Question Has Been Solved by an Expert!
Get step-by-step solutions from verified subject matter experts
Step: 2 Unlock
Step: 3 Unlock