

Question: develop a Matlab program which can take displacement data (provided here as csv files) and in turn produce the following graphs: 1. Cam Shape Polar
develop a Matlab program which can take displacement data (provided here as csv files) and in turn produce the following graphs:
1. Cam Shape Polar Plot - Use a base circle of 2 inches for both problems
2. Displacement Plot
3. Velocity Plot
4. Acceleration Plot
5. Jerk Plot
Once completed, add these plots to a Word file (along with your matlab code)
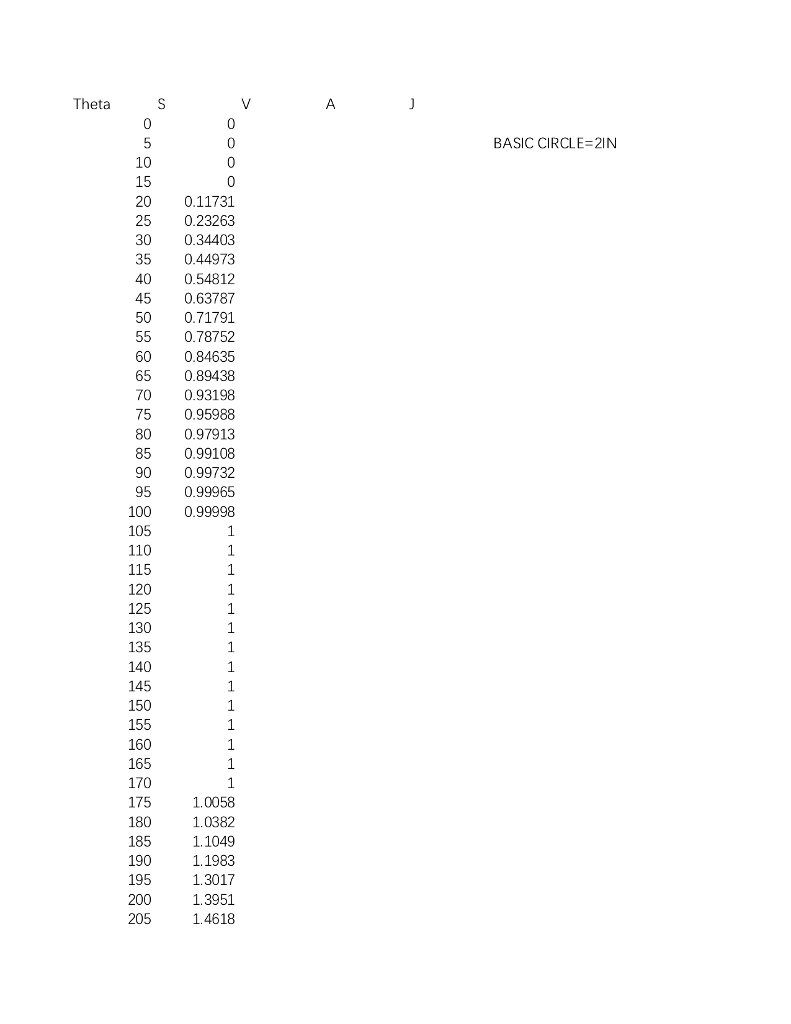
hint: The two rows of data are for theta and S.
Theta S BASIC CIRCLE-2IN 10 20 0.11731 25 0.23263 30 0.34403 35 0.44973 40 0.54812 45 0.63787 50 0.71791 55 0.78752 60 0.84635 65 0.89438 70 0.93198 75 0.95988 80 0.97913 85 0.99108 90 0.99732 95 0.99965 100 0.99998 105 110 115 120 125 130 135 140 145 150 155 160 165 170 175 180 1.0382 185 11049 190 11983 195 13017 200 1.3951 1.0058 205 14618 2 Theta S BASIC CIRCLE-2IN 10 20 0.11731 25 0.23263 30 0.34403 35 0.44973 40 0.54812 45 0.63787 50 0.71791 55 0.78752 60 0.84635 65 0.89438 70 0.93198 75 0.95988 80 0.97913 85 0.99108 90 0.99732 95 0.99965 100 0.99998 105 110 115 120 125 130 135 140 145 150 155 160 165 170 175 180 1.0382 185 11049 190 11983 195 13017 200 1.3951 1.0058 205 14618 2
Step by Step Solution
There are 3 Steps involved in it

Get step-by-step solutions from verified subject matter experts