

Question: develop a Matlab program which can take displacement data (provided here as csv files) and in turn produce the following graphs: 1. Cam Shape Polar
develop a Matlab program which can take displacement data (provided here as csv files) and in turn produce the following graphs:
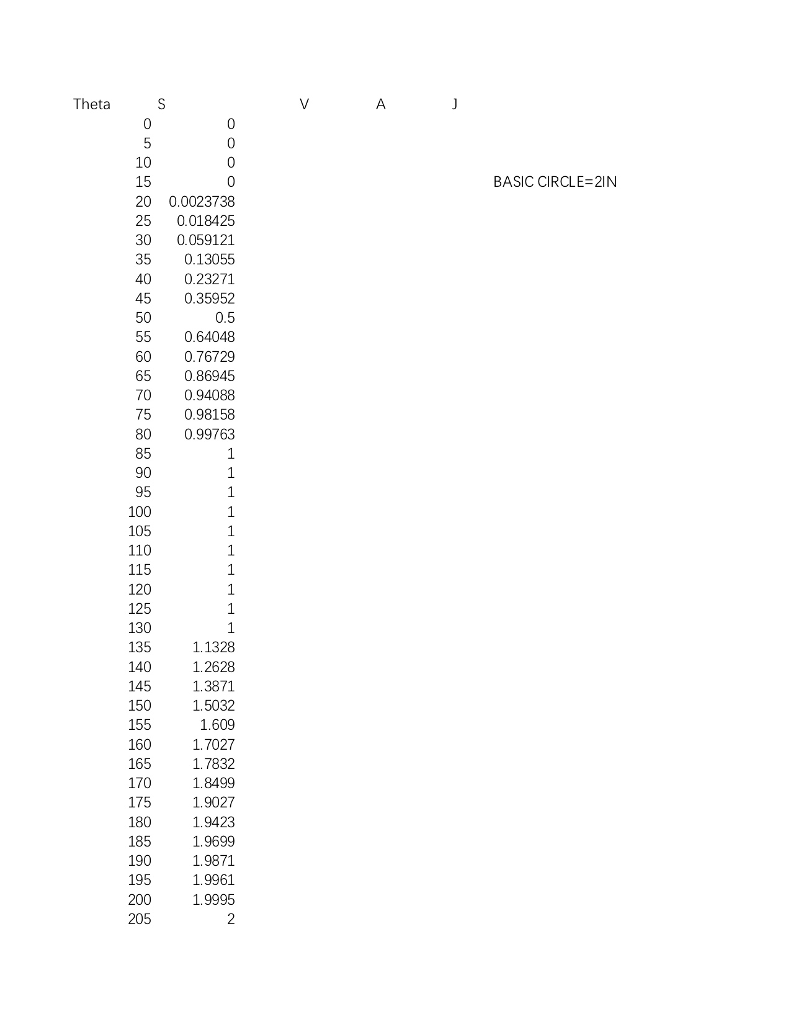
1. Cam Shape Polar Plot - Use a base circle of 2 inches for both problems
2. Displacement Plot
3. Velocity Plot
4. Acceleration Plot
5. Jerk Plot
Once completed, add these plots to a Word file (along with your matlab code)
There show be 5 diagrams..
2 2 2 200123 9 05050505050505050505 112233445566778899 5050505050505050505 33445566778899 2 2 2 200123 9 05050505050505050505 112233445566778899 5050505050505050505 33445566778899
Step by Step Solution
There are 3 Steps involved in it
1 Expert Approved Answer
Step: 1 Unlock

Question Has Been Solved by an Expert!
Get step-by-step solutions from verified subject matter experts
Step: 2 Unlock
Step: 3 Unlock