

Question: Develop a PHP code to generate a bar chart of new Covid-19 cases based on data in Table 1 using GD Library (refer to
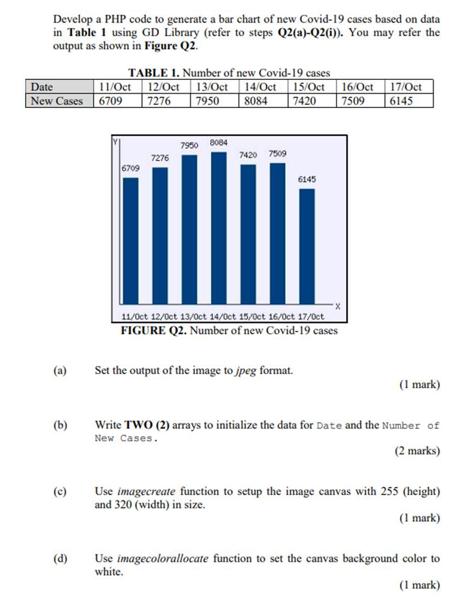
Develop a PHP code to generate a bar chart of new Covid-19 cases based on data in Table 1 using GD Library (refer to steps Q2(a)-Q2(i)). You may refer the output as shown in Figure Q2. TABLE 1. Number of new Covid-19 cases Date 11/Oct New Cases 6709 12/Oct 7276 13/Oct 14/Oct 15/Oct 7950 8084 7420 16/Oct 7509 17/Oct 6145 7950 8084 7276 7420 7509 6709 6145 11/Oct 12/Oct 13/Oct 14/Oct 15/Oct 16/Oct 17/Oct FIGURE Q2. Number of new Covid-19 cases (a) Set the output of the image to jpeg format. (b) (c) (d) (1 mark) Write TWO (2) arrays to initialize the data for Date and the Number of New Cases. (2 marks) Use imagecreate function to setup the image canvas with 255 (height) and 320 (width) in size. (1 mark) Use imagecolorallocate function to set the canvas background color to white. (1 mark)
Step by Step Solution
There are 3 Steps involved in it

Get step-by-step solutions from verified subject matter experts