

Question: Some computer output is shown on the next page from an analysis to compare mean commute time between males and females using data from St.
Some computer output is shown on the next page from an analysis to compare mean commute time between males and females using data from St. Louis commuters in CommuteStLouis. Write a paragraph interpreting what this output shows about the relationship (if any) between commuting time and gender in St. Louis.
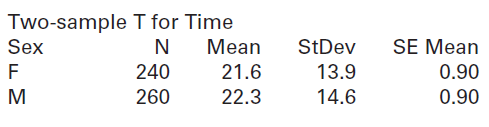
Difference = mu (F) - mu (M)
Estimate for difference: -0.70
95% CI for difference: (-3.20, 1.80)
T-Test of difference = 0 (vs not =): T-Value = -0.55 P-Value = 0.585 DF = 497
Two-sample I for Time Mean Sex StDev SE Mean 240 21.6 13.9 0.90 14.6 0.90 260 22.3
Step by Step Solution
★★★★★
3.47 Rating (160 Votes )
There are 3 Steps involved in it
1 Expert Approved Answer
Step: 1 Unlock

The sample includes 240 females and 260 males both large enough ... View full answer
Question Has Been Solved by an Expert!
Get step-by-step solutions from verified subject matter experts
Step: 2 Unlock
Step: 3 Unlock