

Question: Develop a source-panel computer program to compute the pressure distribution, at zero lift angle of attack, on a well-known airfoil: the NASA-developed 2md generation, supercritical
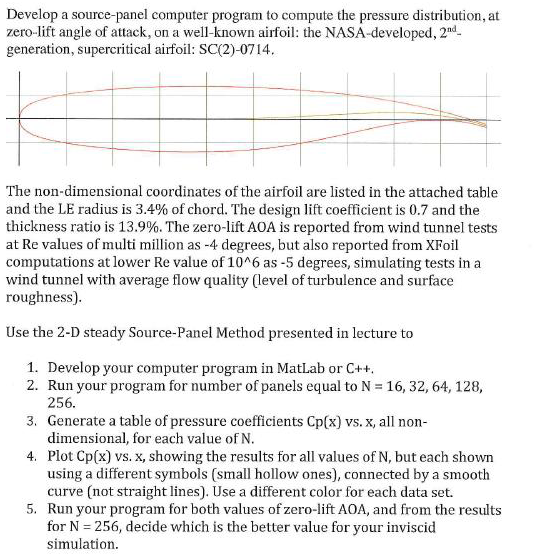
Develop a source-panel computer program to compute the pressure distribution, at zero lift angle of attack, on a well-known airfoil: the NASA-developed 2md generation, supercritical airfoil: SC(2)-0714 The non-dimensional coordinates of the airfoil are listed in the attached table and the LE radius is 3.4% of chord. The design lift coefficient is 0.7 and the thickness ratio is 13.9%. The zero-lift AOA is reported from wind tunnel tests at Re values of multi million as -4 degrees, but also reported from XFoil computations at lower Re value of 10A6 as-5 degrees, simulating tests in a wind tunnel with average flow quality (level of turbulence and surface roughness) Use the 2-D steady Source-Panel Method presented in lecture to 1. 2. Run your program for number of panels equal to N 16, 32, 64, 128, 3. Generate a table of pressure coefficients Cp(x) vs. x, all non 4. Plot Cp(x) vs. x, showing the results for all values of N, but each shown Develop your computer program in MatLab or C++ 256. dimensional, for each value of N using a different symbols (small hollow ones), connected by a smooth curve (not straight lines). Use a different color for each data set. 5. Run your program for both values of zero-lift AOA, and from the results for N 256, decide which is the better value for your inviscid simulation Develop a source-panel computer program to compute the pressure distribution, at zero lift angle of attack, on a well-known airfoil: the NASA-developed 2md generation, supercritical airfoil: SC(2)-0714 The non-dimensional coordinates of the airfoil are listed in the attached table and the LE radius is 3.4% of chord. The design lift coefficient is 0.7 and the thickness ratio is 13.9%. The zero-lift AOA is reported from wind tunnel tests at Re values of multi million as -4 degrees, but also reported from XFoil computations at lower Re value of 10A6 as-5 degrees, simulating tests in a wind tunnel with average flow quality (level of turbulence and surface roughness) Use the 2-D steady Source-Panel Method presented in lecture to 1. 2. Run your program for number of panels equal to N 16, 32, 64, 128, 3. Generate a table of pressure coefficients Cp(x) vs. x, all non 4. Plot Cp(x) vs. x, showing the results for all values of N, but each shown Develop your computer program in MatLab or C++ 256. dimensional, for each value of N using a different symbols (small hollow ones), connected by a smooth curve (not straight lines). Use a different color for each data set. 5. Run your program for both values of zero-lift AOA, and from the results for N 256, decide which is the better value for your inviscid simulation
Step by Step Solution
There are 3 Steps involved in it

Get step-by-step solutions from verified subject matter experts