

Question: Develop a statement of operations for 2017 using Tables II, IV-A, IV-B, and IV-C [at the end of this case study] and a balance sheet
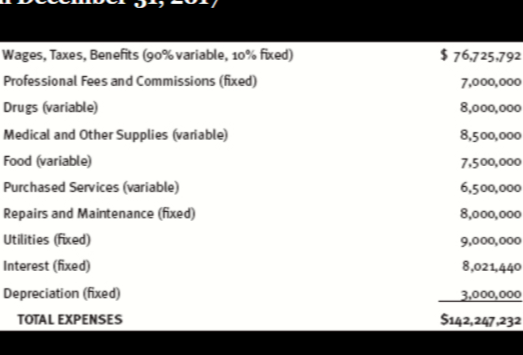
Develop a statement of operations for 2017 using Tables II, IV-A, IV-B, and IV-C [at the end of this case study] and a balance sheet for 2017 (you can assume the format and numbers are correct on the 2016 balance sheet in Table I, and you can further assume that all balances on the 2016 balance sheet carry forward to the 2017 balance sheet with the exception of accounting for the profit or loss from the 2017 statement of operations). Analyze the financial statements using ratio analysis with benchmarks found in Table III and identify strengths and weaknesses and then make recommendations for improvement in 2018.
![and IV-C [at the end of this case study] and a balance](https://dsd5zvtm8ll6.cloudfront.net/si.experts.images/questions/2024/09/66f71097c63bd_67166f710973bcb5.jpg)
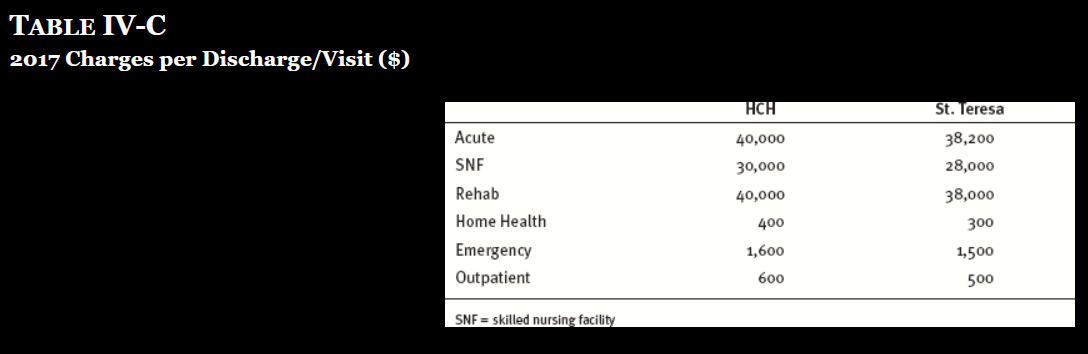
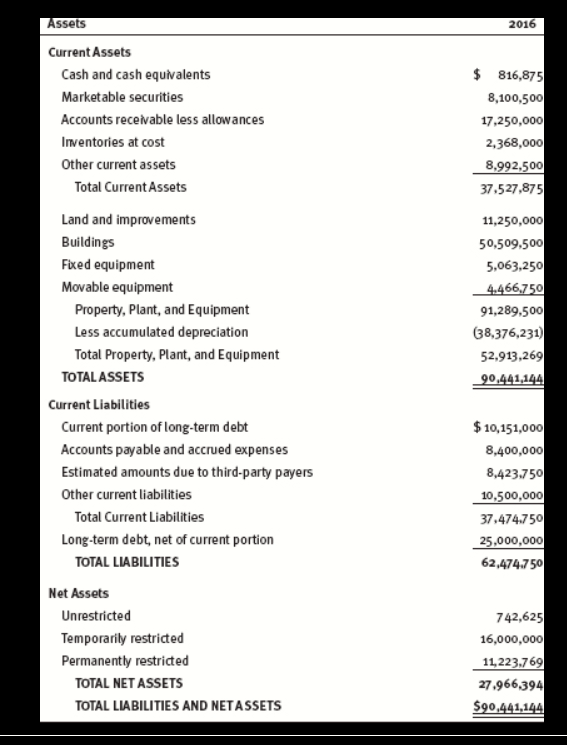
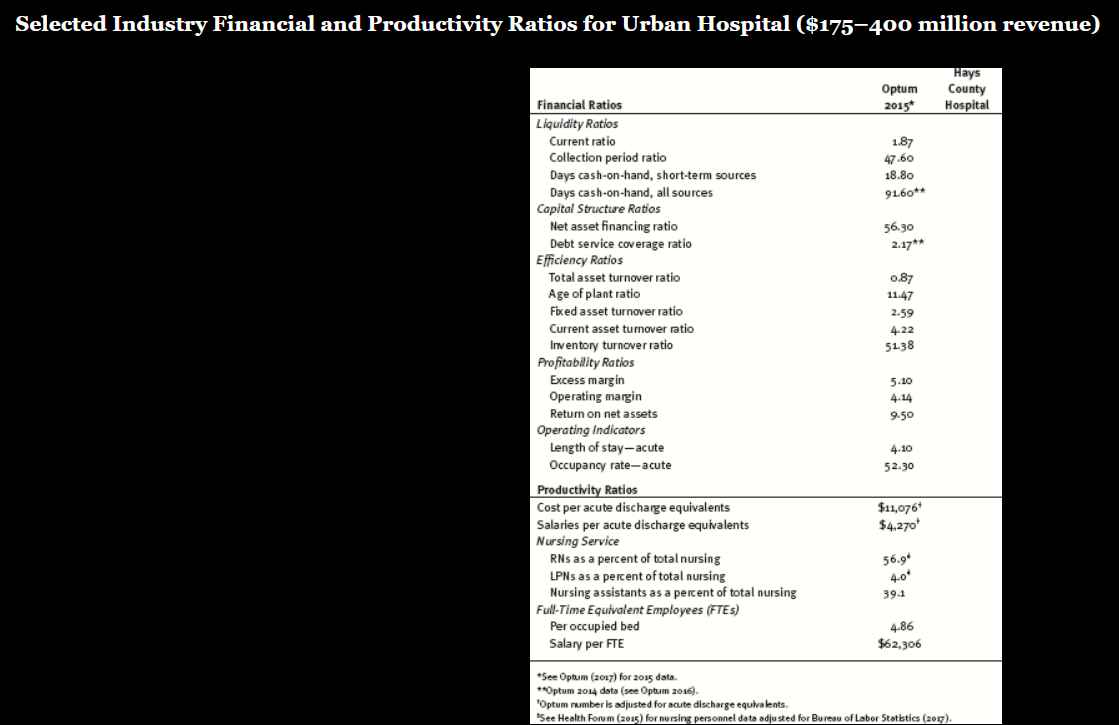
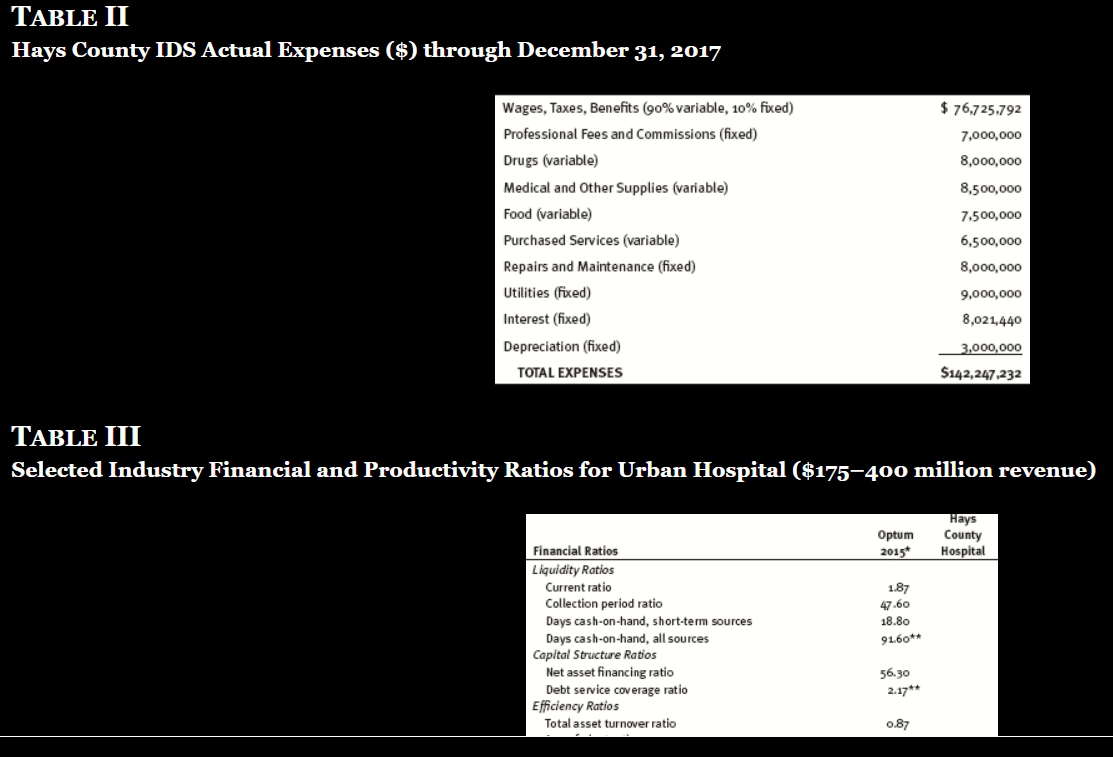
Wages, Taxes, Benefits ( 90% variable, 10% fixed) $76,725,792 Professional Fees and Commissions (fixed) Drugs (variable) Medical and Other Supplies (variable) Food (variable) Purchased Services (variable) Repairs and Maintenance (fixed) Utilities (fuxed) Interest (fixed) Depreciation (fixed) TOTAL EXPENSES $142,247,232 LOS= length of stay; SNF = skilled nursing facility TABLE IV-C 2017 Charges per Discharge/Visit (\$) Assets 2016 Current Assets Cash and cash equivalents $816,875 Marketable securities 8,100,500 Accounts receivable less allowances 17,250,000 Inventories at cost Other current assets Total Current Assets 2,368,0008,992,50037,527,875 Land and improvements 11,250,000 Buildings 50,509,500 Fixed equipment 5,063,250 Movable equipment Property, Plant, and Equipment Less accumulated depreciation Total Property, Plant, and Equipment TOTAL ASSETS Current Liabilities Current portion of long-term debt $10,151,000 Accounts payable and accrued expenses 8,400,000 Estimated amounts due to third-party payers 8,423,750 Other current liabilities Total Current Liabilities Long-term debt, net of current portion TOTAL LIABILITIES TOTAL LIABILITES 10,500,00037,474,75025,000,00062,474.750 Net Assets Unrestricted Temporarily restricted Permanently restricted TOTAL NET ASSETS TOTAL LIABILITIES AND NET ASSETS $90,441,144 tOptum number is adjusted for acute discharge equiralents. tSee Health Forum (2e15) for nursing personnel data adjusted for Bureau of Labor Statiatics (2ery). Hays County IDS Actual Expenses (\$) through December 31, 2017 TABLE III Selected Industry Financial and Productivity Ratios for Urban Hospital (\$175-4oo million revenue) Wages, Taxes, Benefits ( 90% variable, 10% fixed) $76,725,792 Professional Fees and Commissions (fixed) Drugs (variable) Medical and Other Supplies (variable) Food (variable) Purchased Services (variable) Repairs and Maintenance (fixed) Utilities (fuxed) Interest (fixed) Depreciation (fixed) TOTAL EXPENSES $142,247,232 LOS= length of stay; SNF = skilled nursing facility TABLE IV-C 2017 Charges per Discharge/Visit (\$) Assets 2016 Current Assets Cash and cash equivalents $816,875 Marketable securities 8,100,500 Accounts receivable less allowances 17,250,000 Inventories at cost Other current assets Total Current Assets 2,368,0008,992,50037,527,875 Land and improvements 11,250,000 Buildings 50,509,500 Fixed equipment 5,063,250 Movable equipment Property, Plant, and Equipment Less accumulated depreciation Total Property, Plant, and Equipment TOTAL ASSETS Current Liabilities Current portion of long-term debt $10,151,000 Accounts payable and accrued expenses 8,400,000 Estimated amounts due to third-party payers 8,423,750 Other current liabilities Total Current Liabilities Long-term debt, net of current portion TOTAL LIABILITIES TOTAL LIABILITES 10,500,00037,474,75025,000,00062,474.750 Net Assets Unrestricted Temporarily restricted Permanently restricted TOTAL NET ASSETS TOTAL LIABILITIES AND NET ASSETS $90,441,144 tOptum number is adjusted for acute discharge equiralents. tSee Health Forum (2e15) for nursing personnel data adjusted for Bureau of Labor Statiatics (2ery). Hays County IDS Actual Expenses (\$) through December 31, 2017 TABLE III Selected Industry Financial and Productivity Ratios for Urban Hospital (\$175-4oo million revenue)
Step by Step Solution
There are 3 Steps involved in it

Get step-by-step solutions from verified subject matter experts