Question: Develop a statement of operations for 2017 using Tables II, IV-A, IV-B, and IV-C [at the end of this case study] and a balance sheet
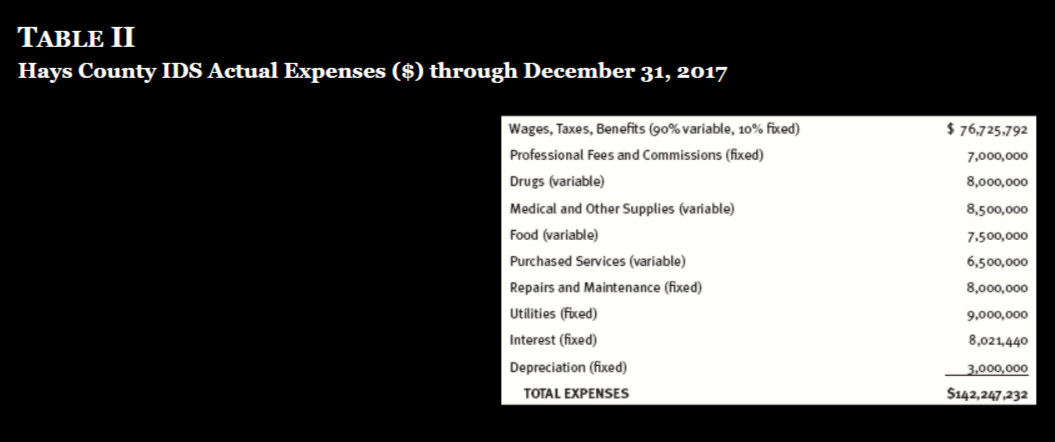
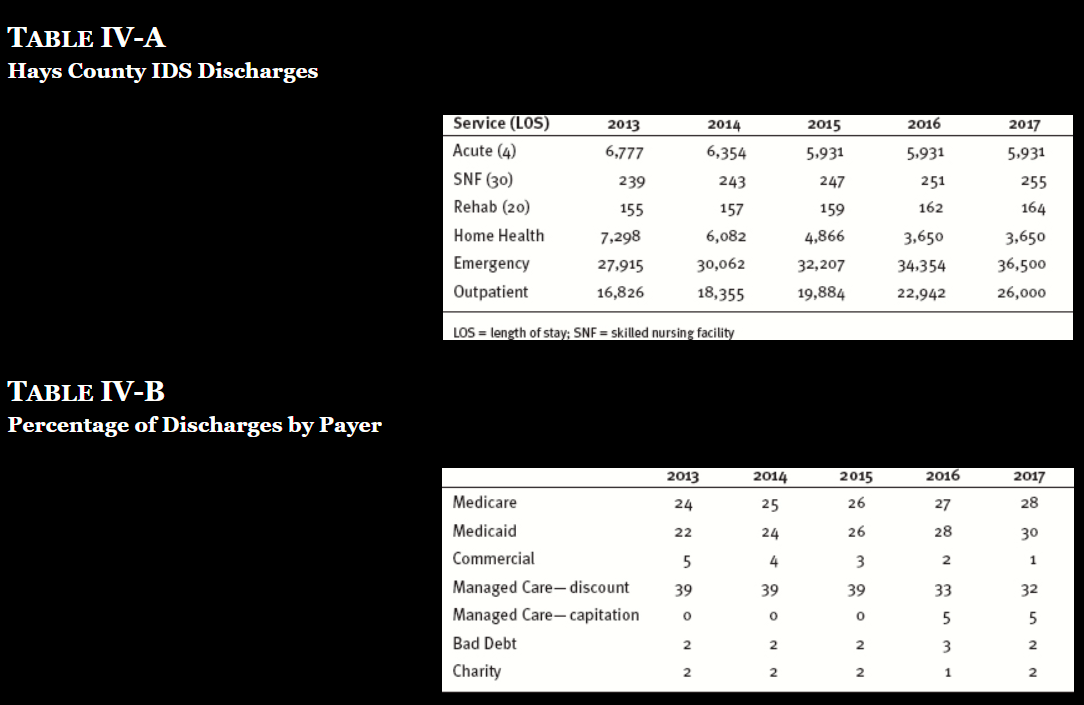
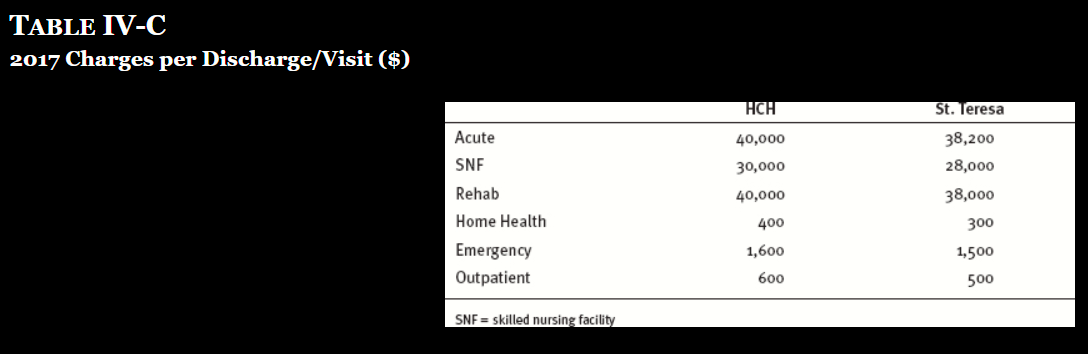
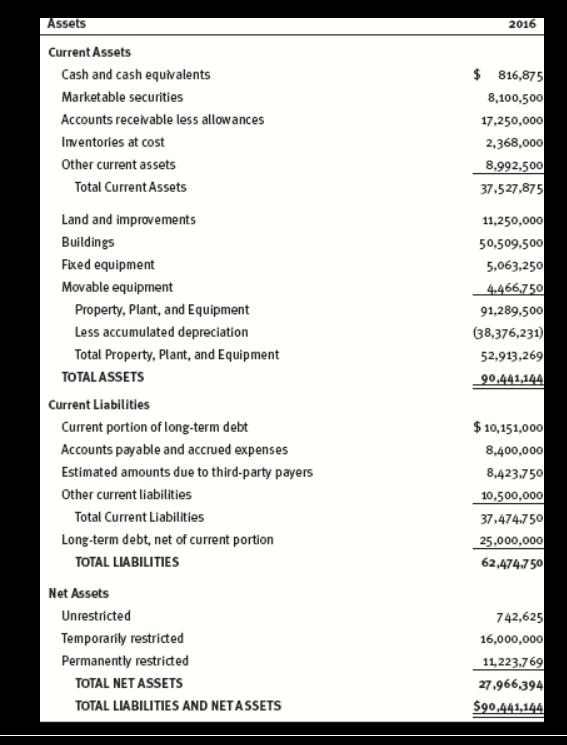
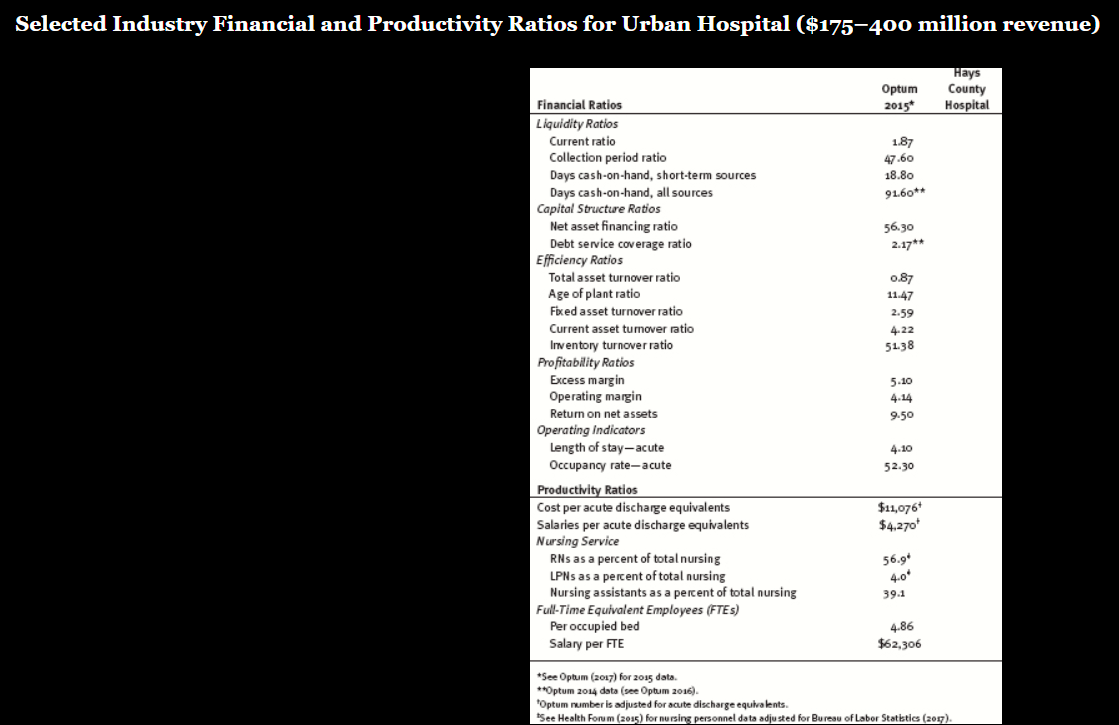
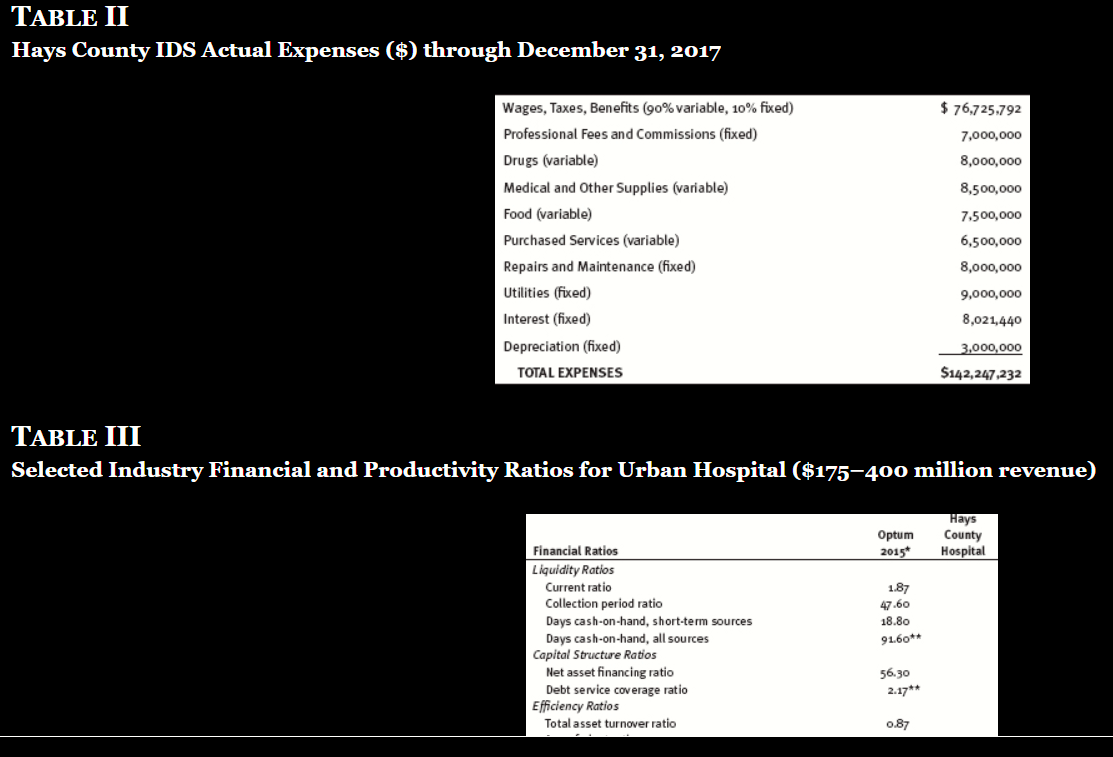
Develop a statement of operations for 2017 using Tables II, IV-A, IV-B, and IV-C [at the end of this case study] and a balance sheet for 2017 (you can assume the format and numbers are correct on the 2016 balance sheet in Table I, and you can further assume that all balances on the 2016 balance sheet carry forward to the 2017 balance sheet with the exception of accounting for the profit or loss from the 2017 statement of operations). Analyze the financial statements using ratio analysis with benchmarks found in Table III and identify strengths and weaknesses and then make recommendations for improvement in 2018.
TABLE II Hays County IDS Actual Expenses ($) through December 31, 2017 Wages, Taxes, Benefits (90% variable, 10% fixed) $ 76,725.792 Professional Fees and Commissions (fixed) 7,000,000 Drugs (variable) 8,000,000 Medical and Other Supplies (variable) 8,500,000 Food (variable) 7.500,000 Purchased Services (variable) 6,500,000 Repairs and Maintenance (fixed) 8,000,000 Utilities (fixed) 9,000,000 Interest (fixed) 8,021,440 Depreciation (fixed) 3,000,000 TOTAL EXPENSES $142,247,232TABLE IV-A Hays County IDS Discharges Service (LOS) 2013 2014 2015 2016 2017 Acute (4) 6,777 6,354 5,931 5,931 5,931 SNF (30) 239 243 247 251 255 Rehab (20) 155 157 159 162 164 Home Health 7,298 6,082 4,866 3,650 3,650 Emergency 27,915 30,062 32,207 34.354 36,500 Outpatient 16,826 18,355 19,884 22,942 26,000 LOS = length of stay; SNF = skilled nursing facility TABLE IV-B Percentage of Discharges by Payer 2013 2014 2015 2016 2017 Medicare 24 25 26 27 28 Medicaid 22 24 26 28 30 Commercial 5 4 3 2 1 Managed Care- discount 39 39 39 33 32 Managed Care- capitation O O 0 5 Bad Debt N 2 2 NN NW Charity N N N\fAssets 2016 Current Assets Cash and cash equivalents $ 816,875 Marketable securities 8,100,500 Accounts receivable less allowances 17,250,000 Inventories at cost 2,368,000 Other current assets 8,992.500 Total Current Assets 37.527.875 Land and improvements 11,250,000 Buildings 50,509,500 Fixed equipment 5,063,250 Movable equipment 4:466.750 Property, Plant, and Equipment 91,289,500 Less accumulated depreciation (38,376,231) Total Property, Plant, and Equipment 52.913,269 TOTALASSETS 90,441,144 Current Liabilities Current portion of long-term debt $ 10,151,000 Accounts payable and accrued expenses 8,400,000 Estimated amounts due to third-party payers 8,423.750 Other current liabilities 10,500,000 Total Current Liabilities 37.474750 Long-term debt, net of current portion 25,000,000 TOTAL LIABILITIES 62,474.750 Net Assets Unrestricted 742,625 Temporarily restricted 16,000,000 Permanently restricted 11, 223.769 TOTAL NET ASSETS 27.966.394 TOTAL LIABILITIES AND NETASSETS $90,441.144Selected Industry Financial and Productivity Ratios for Urban Hospital ($175-400 million revenue) Hays Optum County Financial Ratios 2015* Hospital Liquidity Ratios Current ratio 1.87 Collection period ratio 47.60 Days cash-on-hand, short-term sources 18.80 Days cash-on-hand, all sources 91.60#* Capital Structure Ratios Net asset financing ratio 56.30 Debt service coverage ratio 2.17* * Efficiency Ratios Total asset turnover ratio 0.87 Age of plant ratio 11.47 Fixed asset turnover ratio 2.59 Current asset turnover ratio 4-22 Inventory turnover ratio 51.38 Profitability Ratios Excess margin 5-10 Operating margin 4-14 Return on net assets 9.50 Operating Indicators Length of stay-acute 4-10 Occupancy rate-acute 52.30 Productivity Ratios Cost per acute discharge equivalents $11,076+ Salaries per acute discharge equivalents $4.270 Nursing Service RNs as a percent of total nursing 56.0 LPNs as a percent of total nursing 4.0 Nursing assistants as a percent of total nursing 391 Full-Time Equivalent Employees (FTEs) Per occupied bed 4.86 Salary per FTE $62,306 *See Optum (2017) for 2015 data. #*Optum 2014 data (see Optum 2016). "Optum number is adjusted for acute discharge equivalents. See Health Forum (2035) for nursing personnel data adjusted for Bureau of Labor Statistics (2057)TABLE II Hays County IDS Actual Expenses ($) through December 31, 2017 Wages, Taxes, Benefits (90% variable, 10% fixed) $ 76,725.792 Professional Fees and Commissions (fixed) 7,000,000 Drugs (variable) 8,000,000 Medical and Other Supplies (variable) 8,500,000 Food (variable) 7,500,000 Purchased Services (variable) 6,500,000 Repairs and Maintenance (fixed) 8,000,000 Utilities (fixed) 9,000,000 Interest (fixed) 8,021,440 Depreciation (fixed) 3,000,000 TOTAL EXPENSES $142,247,232 TABLE III Selected Industry Financial and Productivity Ratios for Urban Hospital ($175-400 million revenue) Hays Optum County Financial Ratios 2015* Hospital Liquidity Ratios Current ratio 1.87 Collection period ratio 47.60 Days cash-on-hand, short-term sources 18.80 Days cash-on-hand, all sources 91.60*# Capital Structure Ratios Net asset financing ratio 56.30 Debt service coverage ratio 2.17*# Efficiency Ratios Total asset turnover ratio 0.87
Step by Step Solution
There are 3 Steps involved in it
1 Expert Approved Answer
Step: 1 Unlock
Question Has Been Solved by an Expert!
Get step-by-step solutions from verified subject matter experts
Step: 2 Unlock
Step: 3 Unlock
Students Have Also Explored These Related Finance Questions!