

Question: Develop a Windows Forms application to calculate and display the Mean, Variance, Standard Deviation, Maximum Value, and Maximum Value from 5 data points stored in
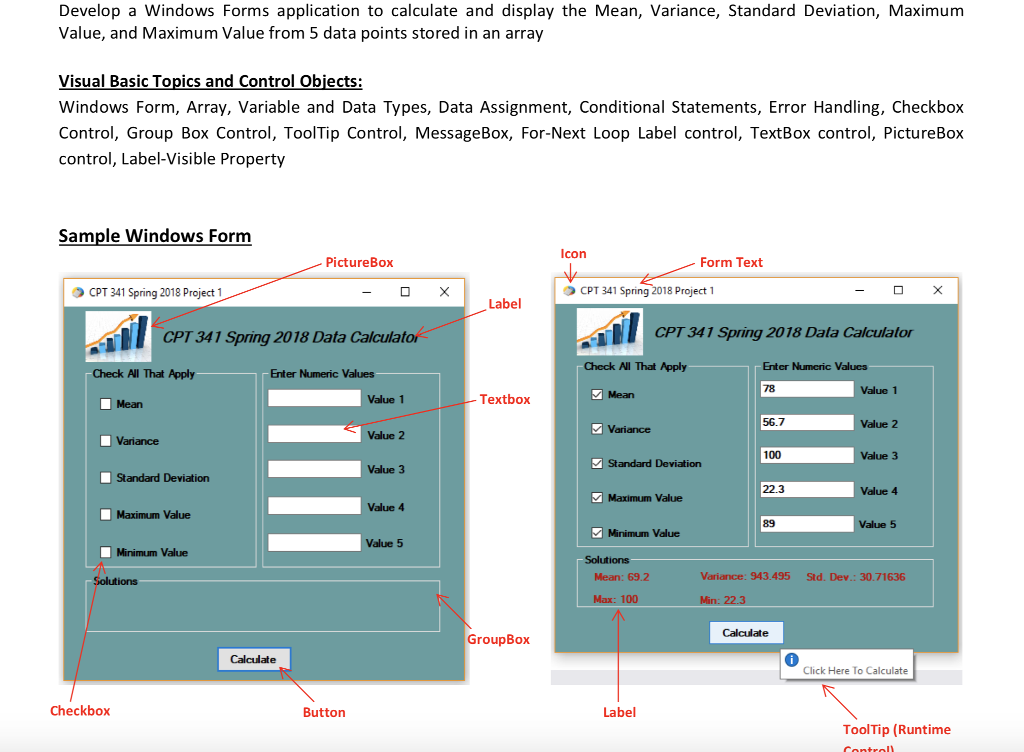
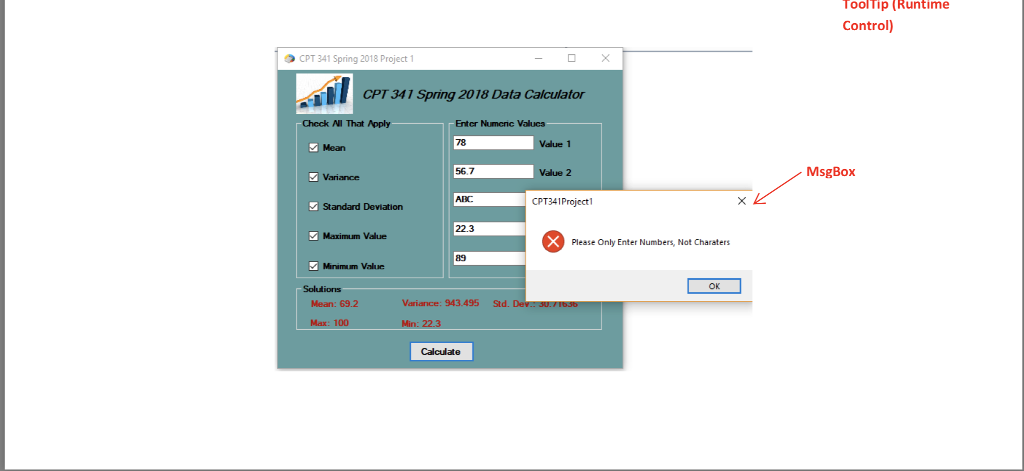
Develop a Windows Forms application to calculate and display the Mean, Variance, Standard Deviation, Maximum Value, and Maximum Value from 5 data points stored in an array Visual Basic Topics an Windows Form, Array, Variable and Data Types, Data Assignment, Conditional Statements, Error Handling, Checkbox Control, Group Box Control, ToolTip Control, MessageBox, For-Next Loop Label control, TextBox control, PictureBox control, Label-Visible Property d Control Obiects Sample Windows Formm Icon PictureBox Form Text CPT 341 Spring 2018 Project 1 CPT 341 Spring 2018 Project 1 Label CPT 341 Spring 2018 Data Calculato CPT 341 Spring 2018 Dala Calculalo Check Al That Apply Enter Numeric Valucs Check All That Apply Enter Numeric Values 78 Value 1 Mean Value 1 Textbox Mean 56.7 Value 2 Variance Value 2 Variance 100 Value 3 Standard Deviation Value 3 Standard Deviation 22.3 Value 4 Maximum Value Value 4 Maximum Value 89 Value 5 Minimum Value Value 5 Minimum Value Solutions Mean: 69.2 Variance: 943.495 Std. Dev.: 30.71636 Max: 100 Min: 22.3 GroupBox Calculate Click Here To Calculate Checkbox Button Label ToolTip (Runtime
Step by Step Solution
There are 3 Steps involved in it

Get step-by-step solutions from verified subject matter experts