

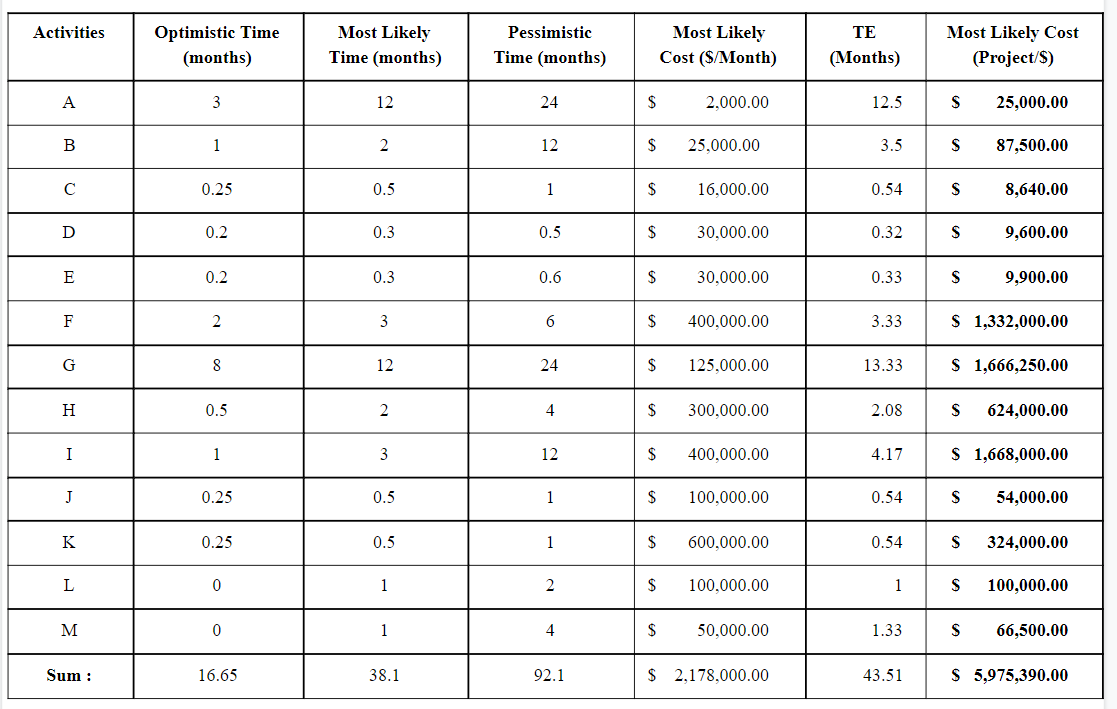
Question: Develop histograms for both the project completion time and the cost to complete the project. What do these histograms tell you? Using the results of
-
Develop histograms for both the project completion time and the cost to complete the project. What do these histograms tell you?
-
Using the results of your simulation analysis, calculate the probability that the project can be completed within 30 months. What is the probability that the project will take longer than 40 months? What is the probability that the project will take between 30 and 40 months? What is the probability the project will cost $5.1 million or less to complete? The probability the project will cost between $5 and $6 mil- lion to complete?
Step by Step Solution
There are 3 Steps involved in it
1 Expert Approved Answer
Step: 1 Unlock

Question Has Been Solved by an Expert!
Get step-by-step solutions from verified subject matter experts
Step: 2 Unlock
Step: 3 Unlock