Question: Develop one exponential smoothing model (stand. dev. = .4) for A, (week 1-26) and B (week 11-27) calculate F < MAD and Tracking signals for

Develop one exponential smoothing model (stand. dev. = .4) for A, (week 1-26) and B (week 11-27)

calculate F< MAD and Tracking signals for the exponential smoothing modelstudent submitted image, transcription available belowI need to lean what Excel functions/formulas to use to solve this please, thank you.

c 3 Q2. Develop the forecasting models and find the forecasting accuracy. Q2-1 (3 points). Develop one exponential smoothing model (a=0.4) for A (week 1-week 26) and B (week 11-week 267). (Keep two decimals) 1 2 Q2-2 (4 points). Calculate FE, MAD, and tracking signals for the exponential smoothing model (a=0.4) for A (week 2-week 26) and B (week 12-week 26). 3 (Keep two decimals) 4 5 A A B 5 Week Actual demand Forecast (a=0.4) Forecast Error (FE) MAD Tracking signal Week Actual demand Forecast (a=0.4) Forecast Error (FE) MAD Tracking signal 7 1 45 45.00 1 3 2 44 2 3 33 3 4 4 20 39 4 1 5 AC 45 5 20 3 2 6 O 30 6 2 3 7 ac 26 7 4 8 45 8 5 9 22 33 9 9 5 10 22 33 10 7 11 co 11 50 11 20 20.00 3 40 12 40 12 30 13 31 13 1.4 13 35 17 42 14 15 52 1 15 20 32 15 CE 55 2 16 A 49 16 42 44 3 17 24 20 17 6 57 18 4 41 18 so 59 19 34 19 46 20 35 20 60 21 52 21 59 22 50 22 60 23 30 23 58 24 37 24 66 25 35 25 55 2 26 50 26 60 27 27 4 5 3 7 3 3 1 3

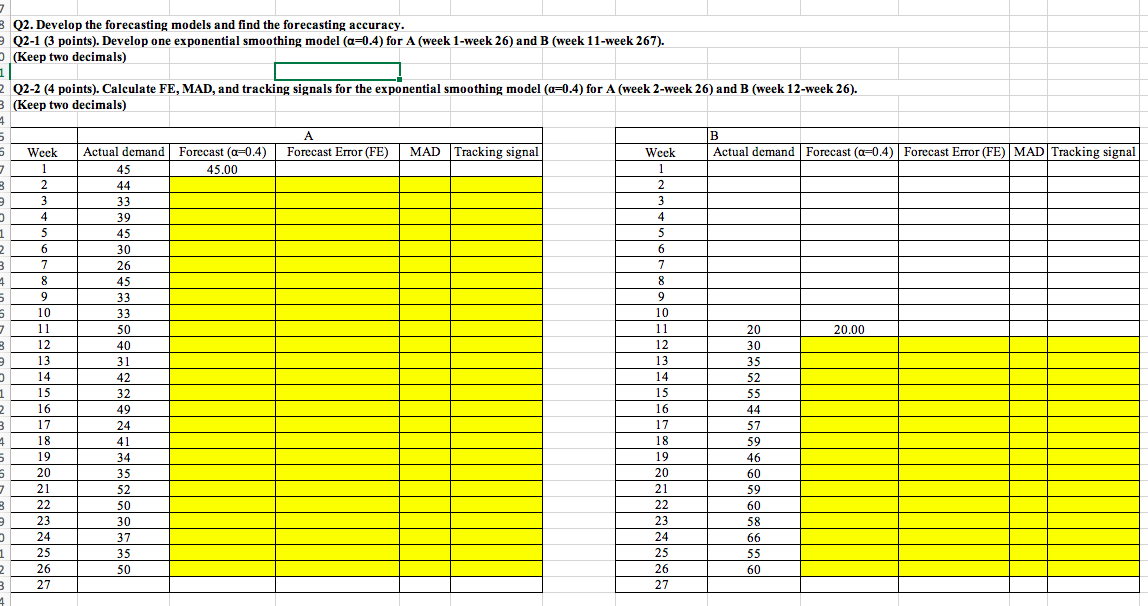
Step by Step Solution

There are 3 Steps involved in it

1 Expert Approved Answer
Step: 1 Unlock blur-text-image
Question Has Been Solved by an Expert!

Get step-by-step solutions from verified subject matter experts

Step: 2 Unlock
Step: 3 Unlock

Students Have Also Explored These Related General Management Questions!