

Question: Use the data in the Excel file Baseball Attendance to do the following a Develop spreadsheet models for forecasting attendance using single moving average
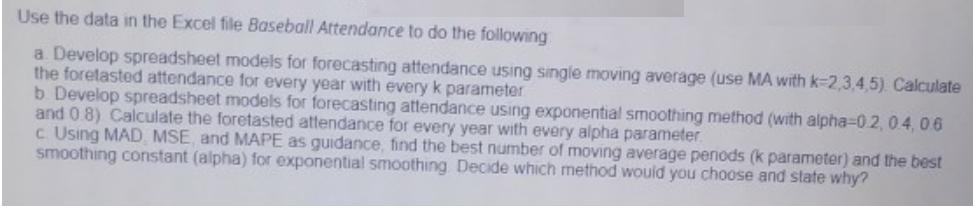
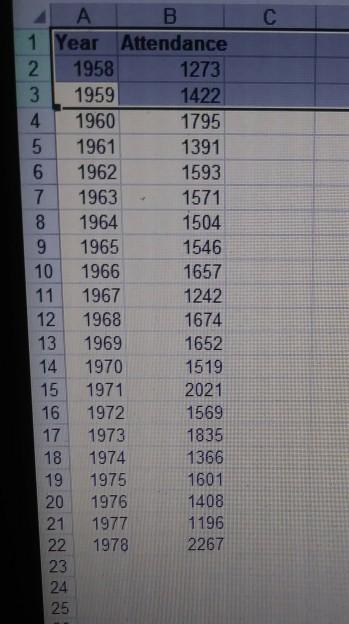
Use the data in the Excel file Baseball Attendance to do the following a Develop spreadsheet models for forecasting attendance using single moving average (use MA with k-2,3,4,5) Calculate the foretasted attendance for every year with every k parameter b Develop spreadsheet models for forecasting attendance using exponential smoothing method (with alpha=0.2, 04, 06 and 0.8) Calculate the foretasted attendance for every year with every alpha parameter c Using MAD MSE, and MAPE as guidance, find the best number of moving average penods (k parameter) and the best smoothing constant (alpha) for exponential smoothing Decide which method would you choose and state why? C 1 Year Attendance 1958 1273 1422 3. 1959 1960 4 1795 1961 1391 1962 1593 7. 1963 1571 8 1964 1504 9. 1965 1546 10 1966 1657 11 1967 1242 12 1968 1674 13 1969 1652 14 1970 1519 15 1971 2021 16 1972 1569 17 1973 1835 18 1974 1366 19 1975 1601 20 1976 1408 21 1977 1196 22 1978 2267 23 24 25
Step by Step Solution
There are 3 Steps involved in it
1 2YMA Year Value Forecast error abs error SE APE 1958 1273 1959 1422 1960 1795 13475 4475 4475 2002563 2493036 1961 1391 16085 2175 2175 4730625 1563623 1962 1593 1593 0 0 0 0 1963 1571 1492 79 79 62... View full answer

Get step-by-step solutions from verified subject matter experts