

Question: Develop the estimated regression equation to explain the relationship between each of your three stocks' returns and that of the market. A B 1 Date
Develop the estimated regression equation to explain the relationship between each of your three stocks' returns and that of the market.
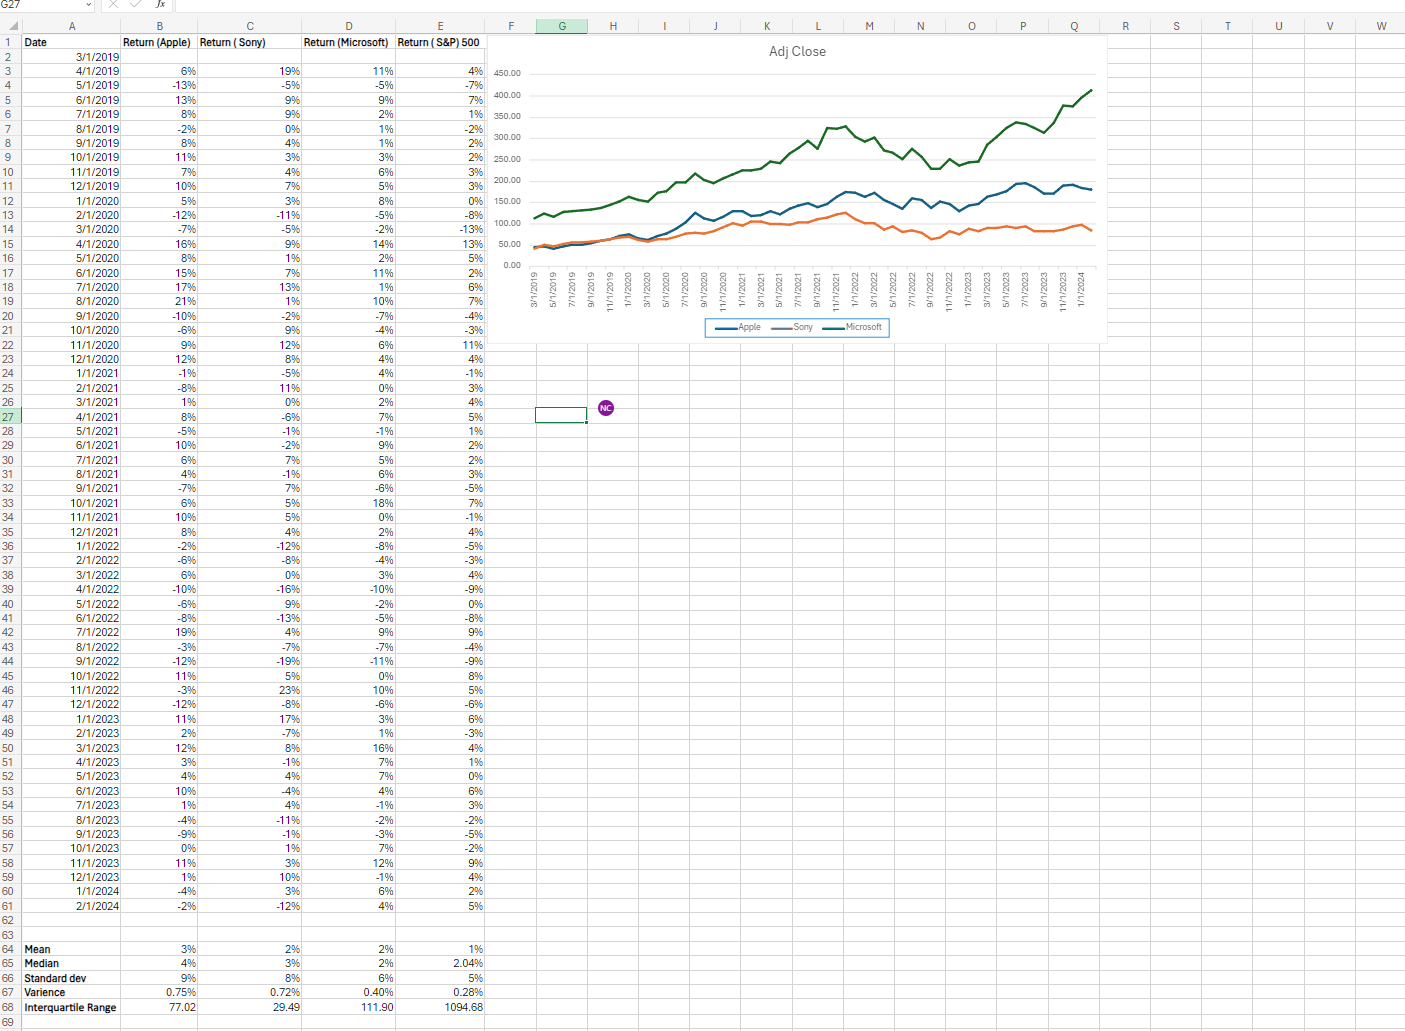
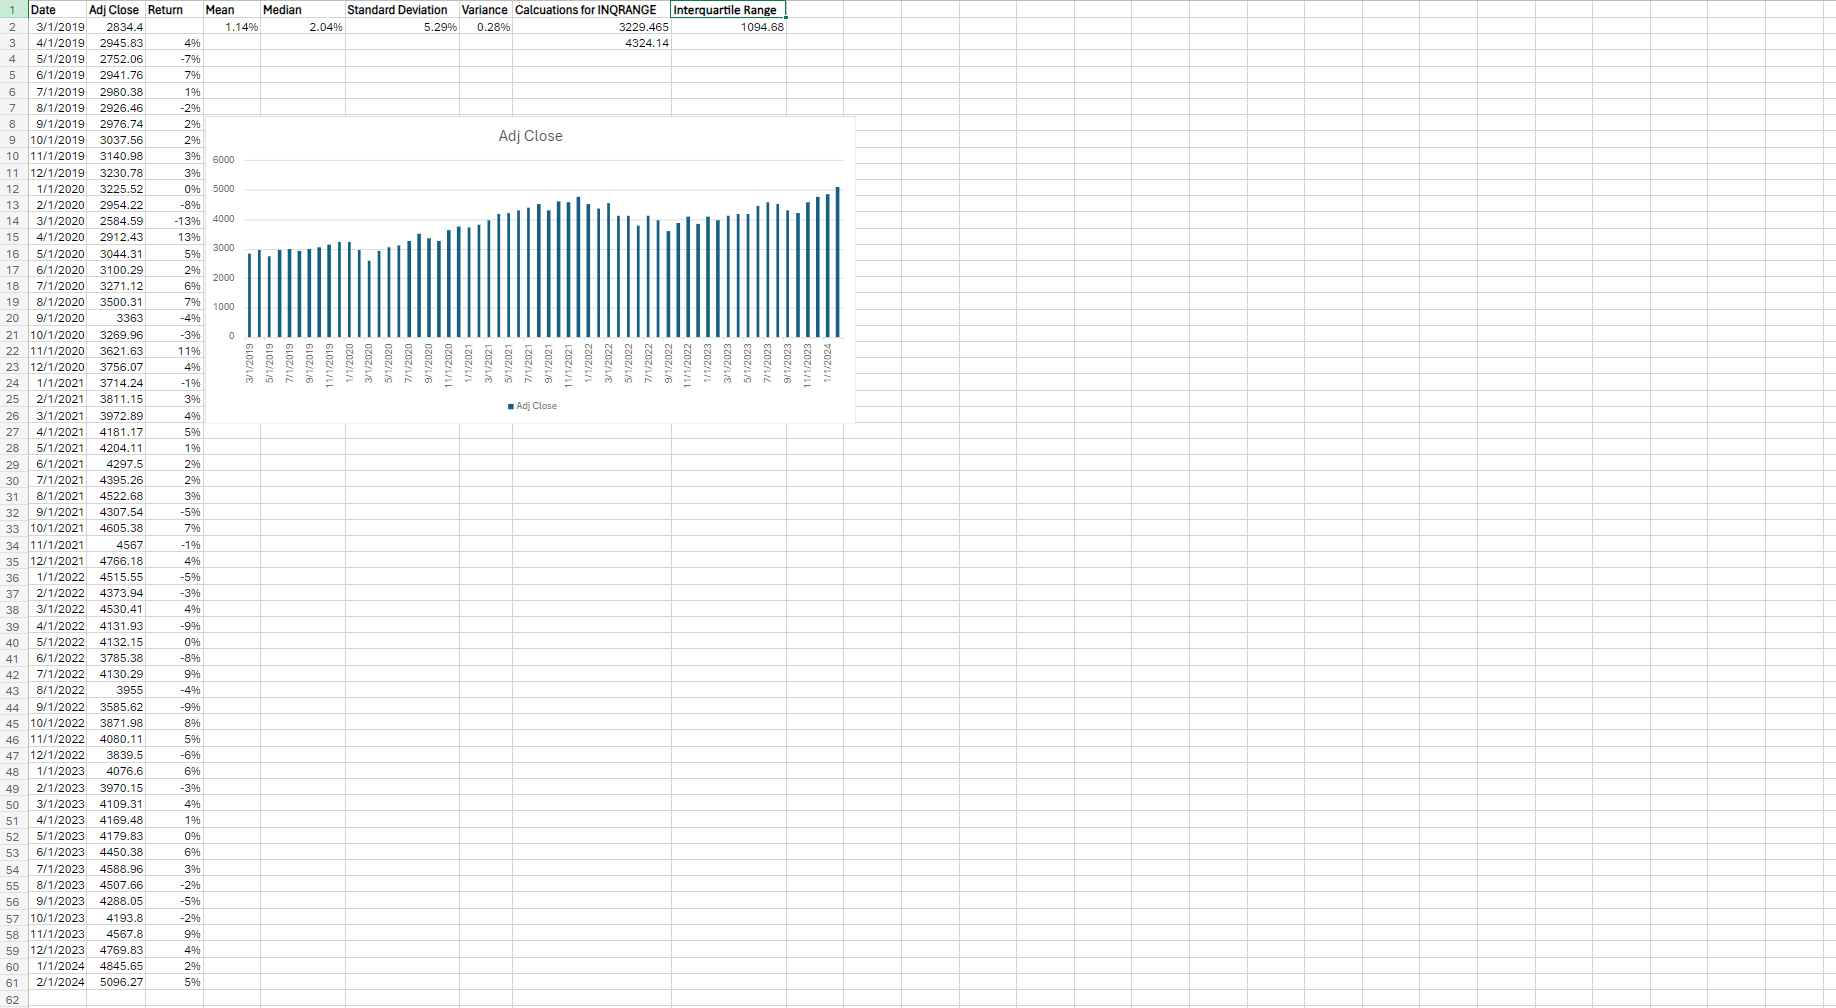
A B 1 Date Return (Apple) Return (Sony) D E F G H J K L M N P R S T U V W Return (Microsoft) Return (S&P) 500 2 3/1/2019 Adj Close 3 4/1/2019 6% 19% 11% 4% 450.00 4 5/1/2019 -13% -5% -5% -7% 400.00 5 6/1/2019 13% 9% 9% 7% 6 7/1/2019 8% 9% 2% 1% 350.00 7 8/1/2019 -2% 0% 1% -2% 300.00 8 9/1/2019 8% 4% 1% 2% 9 10/1/2019 11% 3% 3% 2% 250.00 10 11/1/2019 7% 4% 6% 3% 200.00 11 12/1/2019 10% 7% 5% 3% 12 1/1/2020 5% 3% 8% 0% 150.00 13 2/1/2020 -12% -11% -5% -8% 100.00 14 3/1/2020 -7% -5% -13% 15 4/1/2020 16% 9% 14% 13% 50.00 16 5/1/2020 8% * 2% 5% 0.00 17 6/1/2020 15% 7% 11% 2% 18 7/1/2020 17% 13% 1% 6% 19 8/1/2020 21% 1% 10% 7% 11/1/2022 1/1/2023 3/1/2023 7/1/2023 1/1/2024 20 9/1/2020 -10% -2% -7% -4% 21 10/1/2020 -6% 9% -4% -3% Apple Sony Microsoft 22 11/1/2020 9% 12% 6% 11% 23 12/1/2020 12% 8% 4% 4% 24 1/1/2021 -1% -5% 4% -1% 25 2/1/2021 -8% 11% 0% 3% 26 3/1/2021 1% 0% 2% 4% 27 4/1/2021 8% -6% 7% 5% 28 5/1/2021 -5% -1% -1% 1% 29 6/1/2021 10% -2% 9% 2% 30 7/1/2021 6% 7% 5% 2% 31 8/1/2021 4% -1% 6% 3% 32 9/1/2021 -7% 7% -6% -5% 33 10/1/2021 6% 5% 18% 7% 34 11/1/2021 10% 5% 0% -1% 35 12/1/2021 8% 4% 2% 4% 36 1/1/2022 -2% -12% 37 2/1/2022 -6% -8% 38 3/1/2022 6% 0% 39 4/1/2022 -10% -16% 40 5/1/2022 -6% 9% 41 6/1/2022 -8% -13% 42 7/1/2022 19% 4% 43 8/1/2022 -3% -7% 44 9/1/2022 -12% -19% 45 10/1/2022 11% 5% 46 11/1/2022 -3% 23% 47 12/1/2022 -12% -8% 48 1/1/2023 11% 17% 49 2/1/2023 2% -7% 50 3/1/2023 12% 8% 51 4/1/2023 3% -1% 52 5/1/2023 4% 4% 53 6/1/2023 10% -4% 54 7/1/2023 1% 4% 55 8/1/2023 -4% -11% 56 9/1/2023 -9% -1% 57 10/1/2023 0% 1% 58 11/1/2023 11% 3% 59 12/1/2023 1% 10% 60 1/1/2024 -4% 3% 61 2/1/2024 -2% -12% 6 4 6 6 6 6 6 6 6 6 6 4 64 -5% -3% 4% -9% 0% -8% 9% -4% -9% 8% 5% -6% 6% -3% 4% 1% 0% 6% 3% -2% -5% -2% 9% 4% 2% 5% 62 63 64 Mean 3% 2% 65 Median 4% 3% 66 Standard dev 9% 8% 67 Varience 0.75% 0.72% 0.40% 1% 2.04% 5% 0.28% 68 Interquartile Range 77.02 29.49 111.90 1094.68 69
Step by Step Solution
There are 3 Steps involved in it
Toincreaseananticipatedregression equation forthe connectionbetweenthe returns ofthreesharesand ... View full answer

Get step-by-step solutions from verified subject matter experts