

Question: Devise a null and alternative hypothesis, then test using alpha=0.05 if our class is taller or shorter than the average human in the United States.
- Devise a null and alternative hypothesis, then test using alpha=0.05 if our class is taller or shorter than the average human in the United States. Graphically display your answer and statistically write up results. In addition, determine the effect size of this relationship and interpret.
- Notes:
- The average height of adults in the United States is 67.03.8 inches.
- Calculate and interpret the effect size (use Cohen's d):
- Cohen's d = (Msample- population) ? ?)
- Devise a null and alternative hypothesis, then test using alpha =0.05 if the students in our class that are born in warm weather months are taller or shorter than those born in cold weather months. Graphically display your answer and statistically write up results. In addition, determine the effect size of this relationship and interpret.
- Notes:
- Population SDs are unknown.
- Assume the northern hemisphere:
- Warm months = April, May, June, July, August, September
- Cold months = October, November, December, January, February, March
- Use Cohen's d effect size:
- Cohen's d = (M2- M1) ? SDpooled) where SDpooled= ?((SD12+ SD22) ? 2)
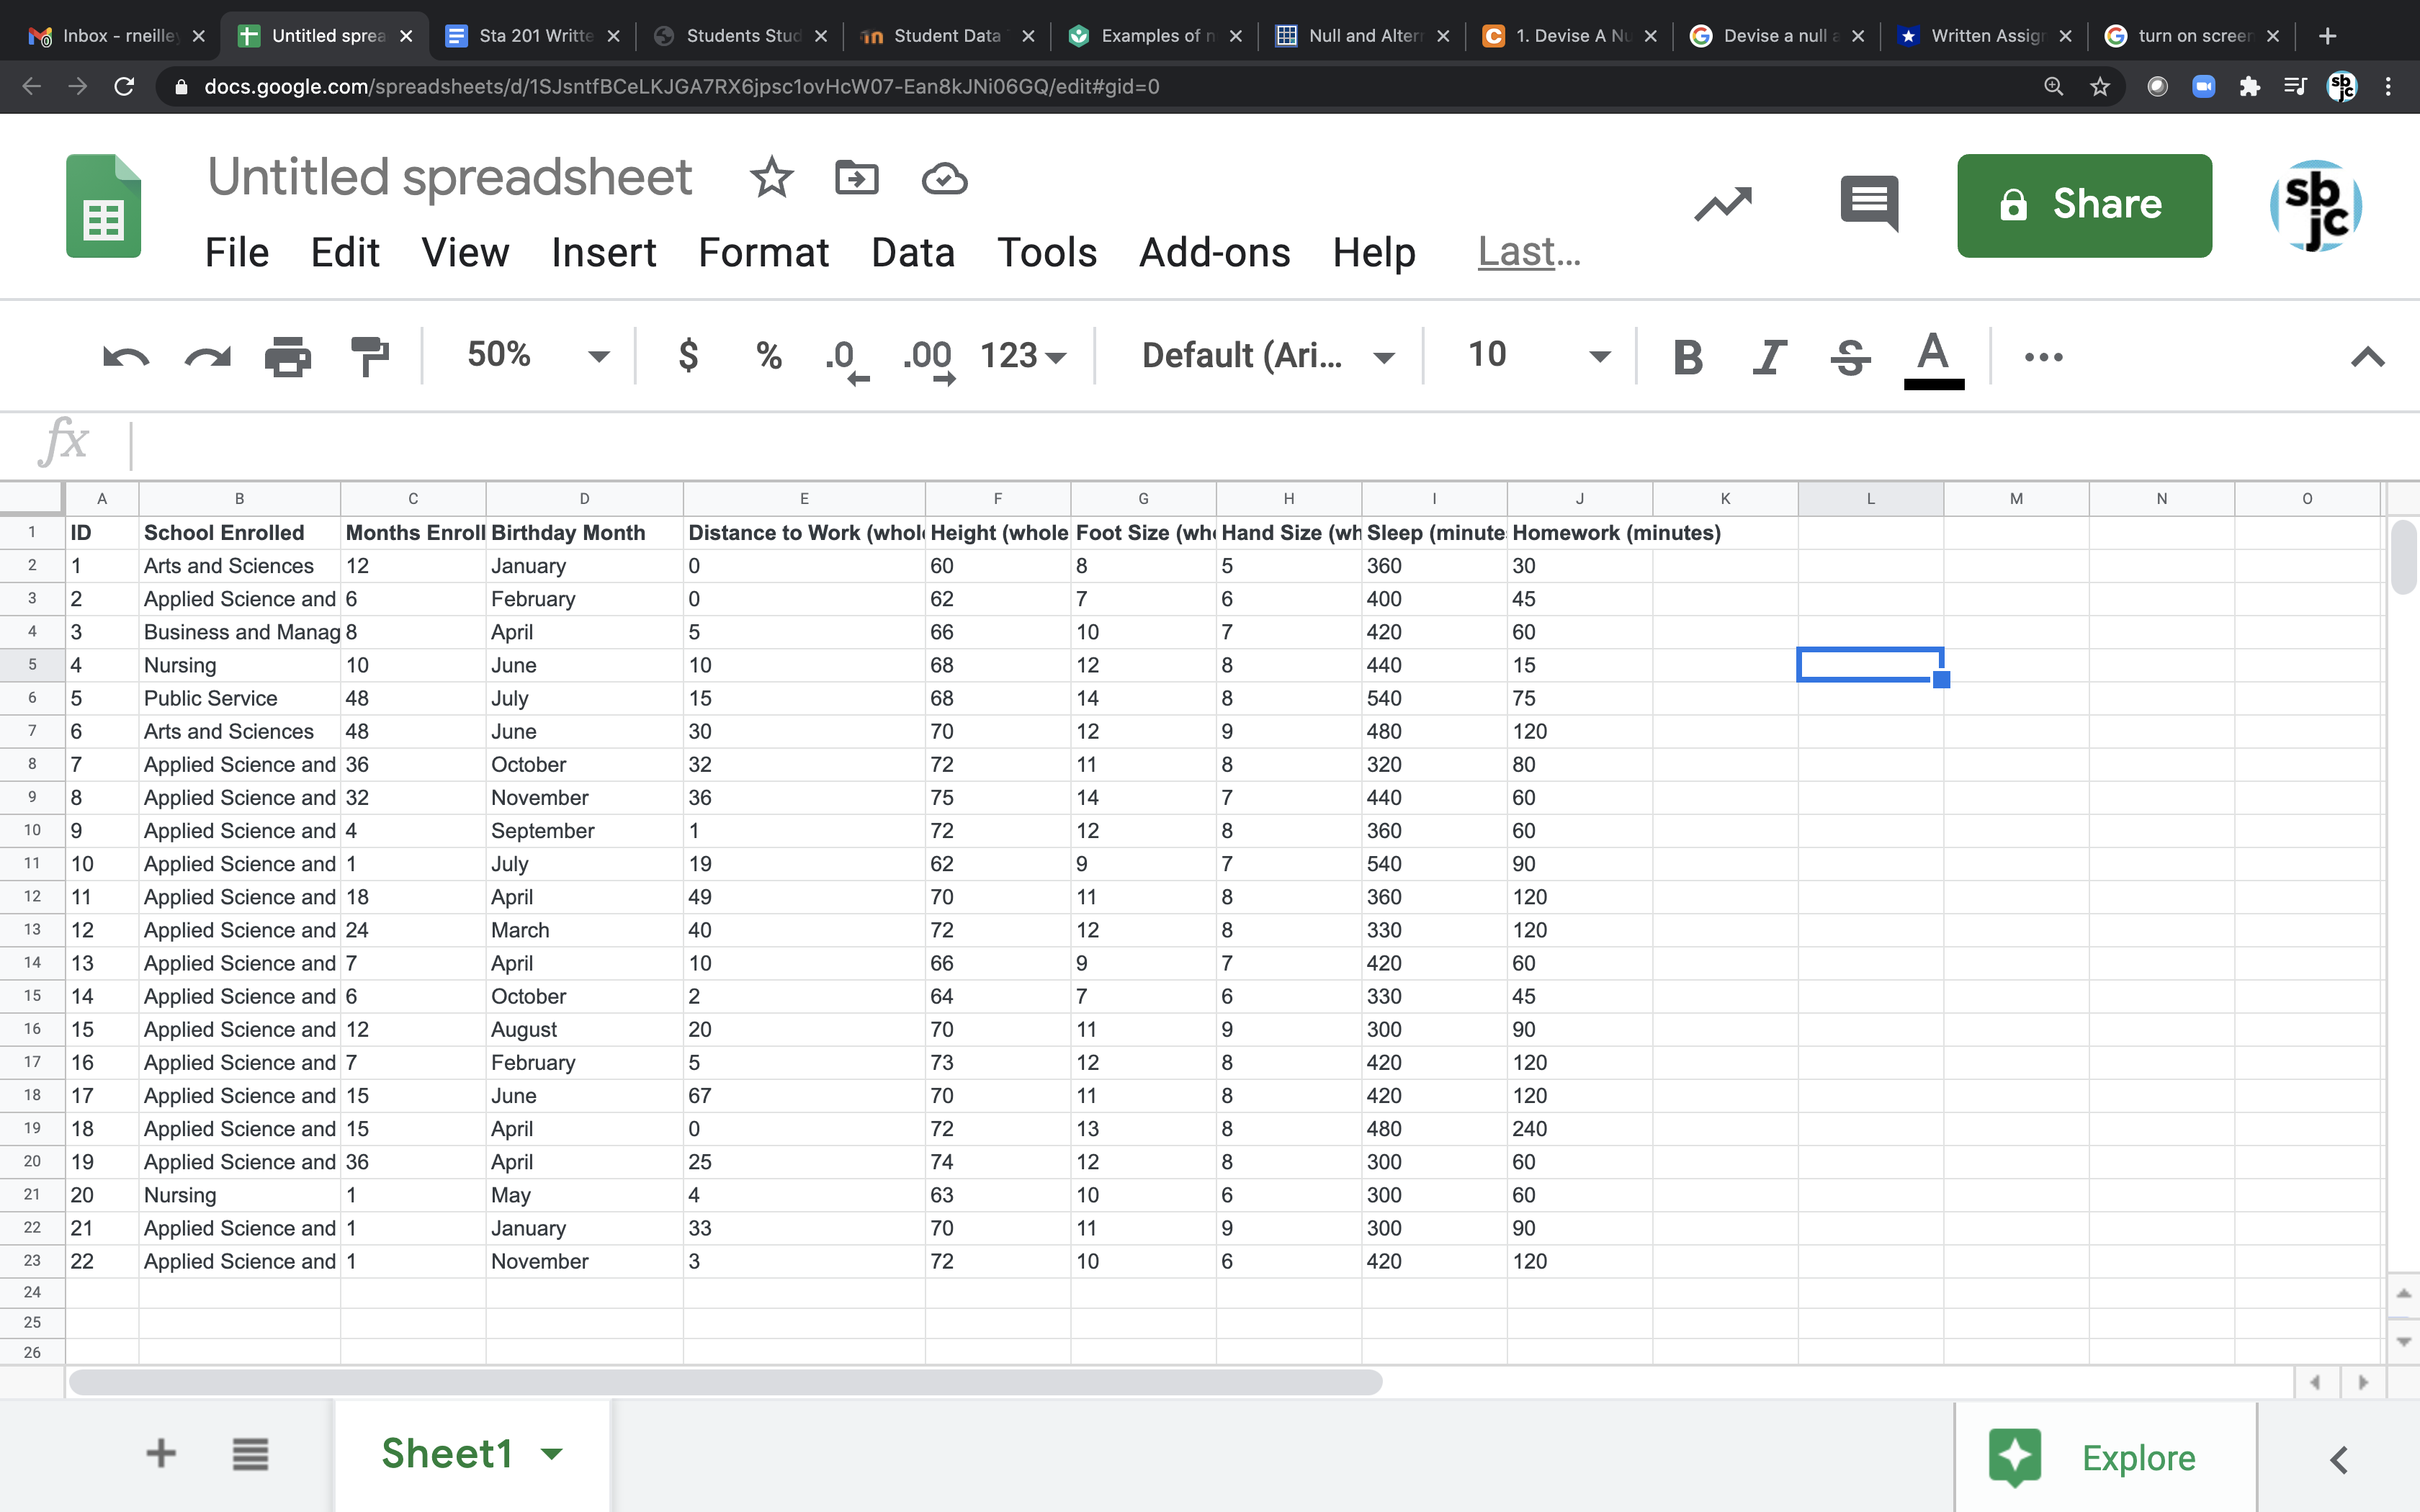
Inbox - rneilley x Untitled spreax Sta 201 Writte X Students Stud X | in Student Data X Examples of n > Null and Alterr X C 1. Devise A Nu X G Devise a null a x Written Assign X G turn on screen x C a docs.google.com/spreadsheets/d/1SJsntfBCeLKJGA7RX6jpsc1ovHcW07-Ean8kJNi06GQ/edit#gid=0 EE Untitled spreadsheet * 2 6 Share sb File Edit View Insert Format Data Tools Add-ons Help Last... 50% $ % .0 .00 123 - Default (Ari... 10 V BIS A . . . fx A C D E F G H J K L M N 0 ID School Enrolled Months Enroll Birthday Month Distance to Work (whole Height (whole Foot Size (who Hand Size (wh Sleep (minute Homework (minutes) 1 Arts and Sciences 12 January 0 60 8 360 30 2 Applied Science and 6 February O 62 400 45 Business and Manag & April 5 66 10 420 60 4 Nursing 10 June 10 68 12 440 15 Public Service 48 July 15 68 14 540 75 16 Arts and Sciences 48 June 30 70 12 480 120 17 Applied Science and 36 October 32 72 11 320 30 18 Applied Science and 32 November 36 75 14 440 60 10 9 Applied Science and 4 September 1 72 12 360 60 11 10 Applied Science and 1 July 19 62 540 90 12 11 Applied Science and 18 April 49 70 360 120 13 12 Applied Science and 24 March 40 330 120 14 Applied Science and 7 April 10 66 420 60 15 14 Applied Science and 6 October IN 64 330 45 16 15 Applied Science and 12 August 20 11 300 90 16 Applied Science and 7 February 420 120 18 17 Applied Science and 15 June 67 420 120 19 18 Applied Science and 15 April 0 72 480 240 20 19 Applied Science and 36 April 25 74 12 300 60 21 20 Nursing May 300 60 22 21 Applied Science and 1 January 33 70 300 90 23 22 Applied Science and 1 November 3 72 10 0 40 0 00 00 00 00 40 6 00 00 00 - 00 40 00 00 - O U 420 120 24 25 26 + Sheet1 + Explore <
Step by Step Solution
There are 3 Steps involved in it

Get step-by-step solutions from verified subject matter experts