

Question: Student Data.xisx Open with A B C D E F G H Distance to School Months Birthday Work Height Foot Size (whole Hand Size (whole
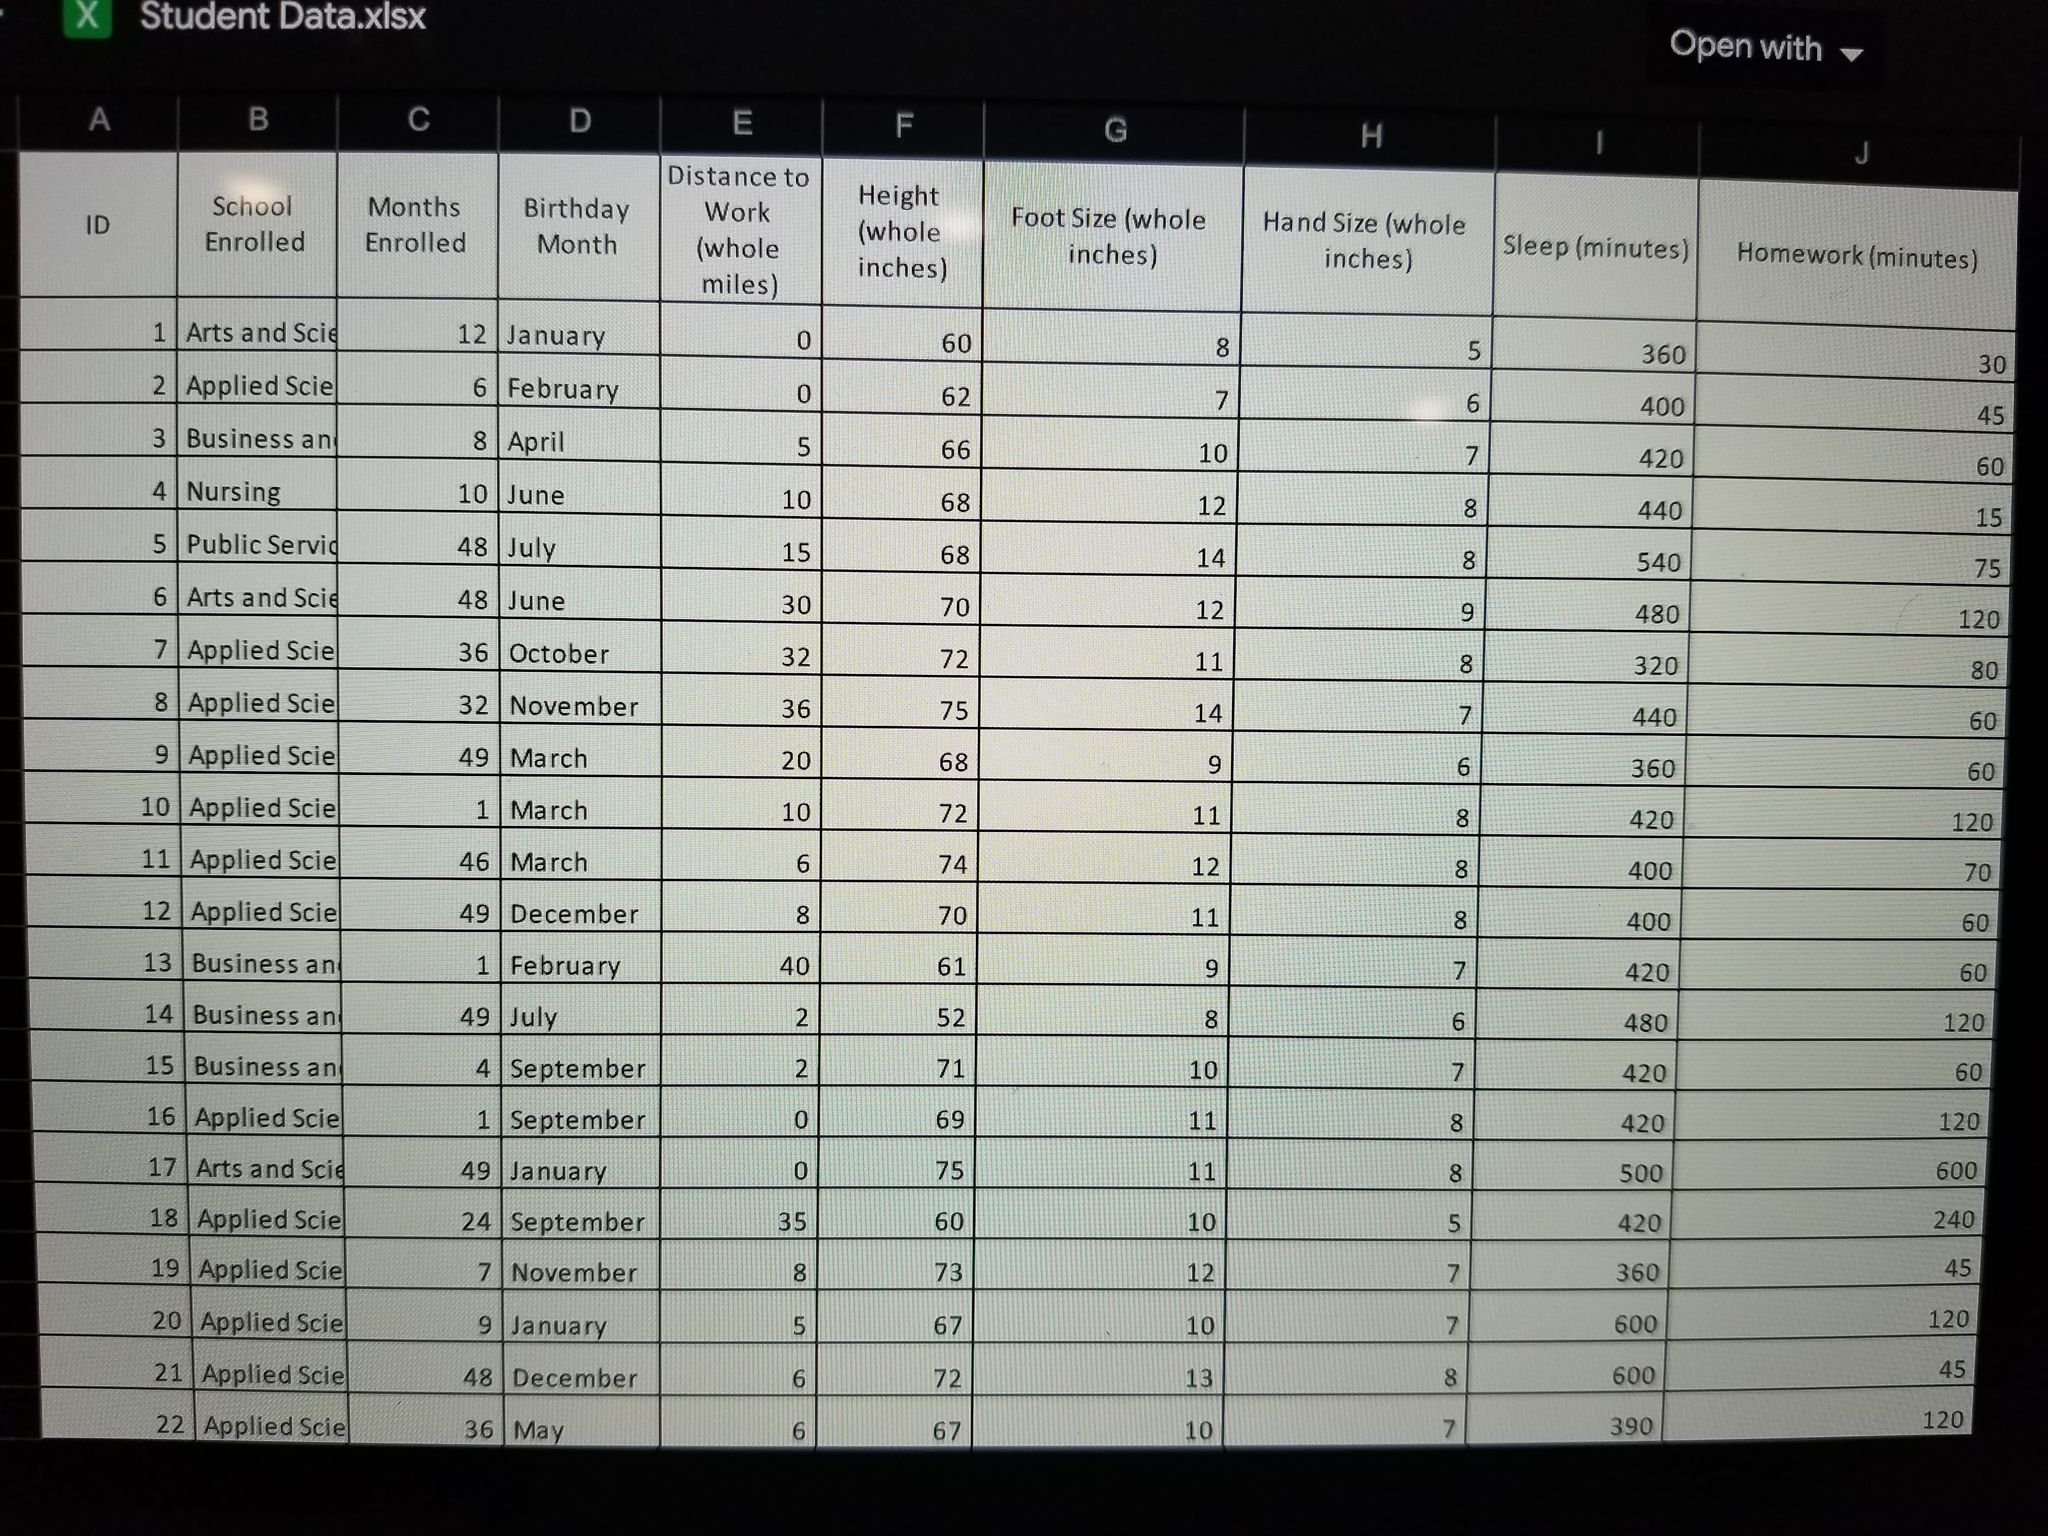
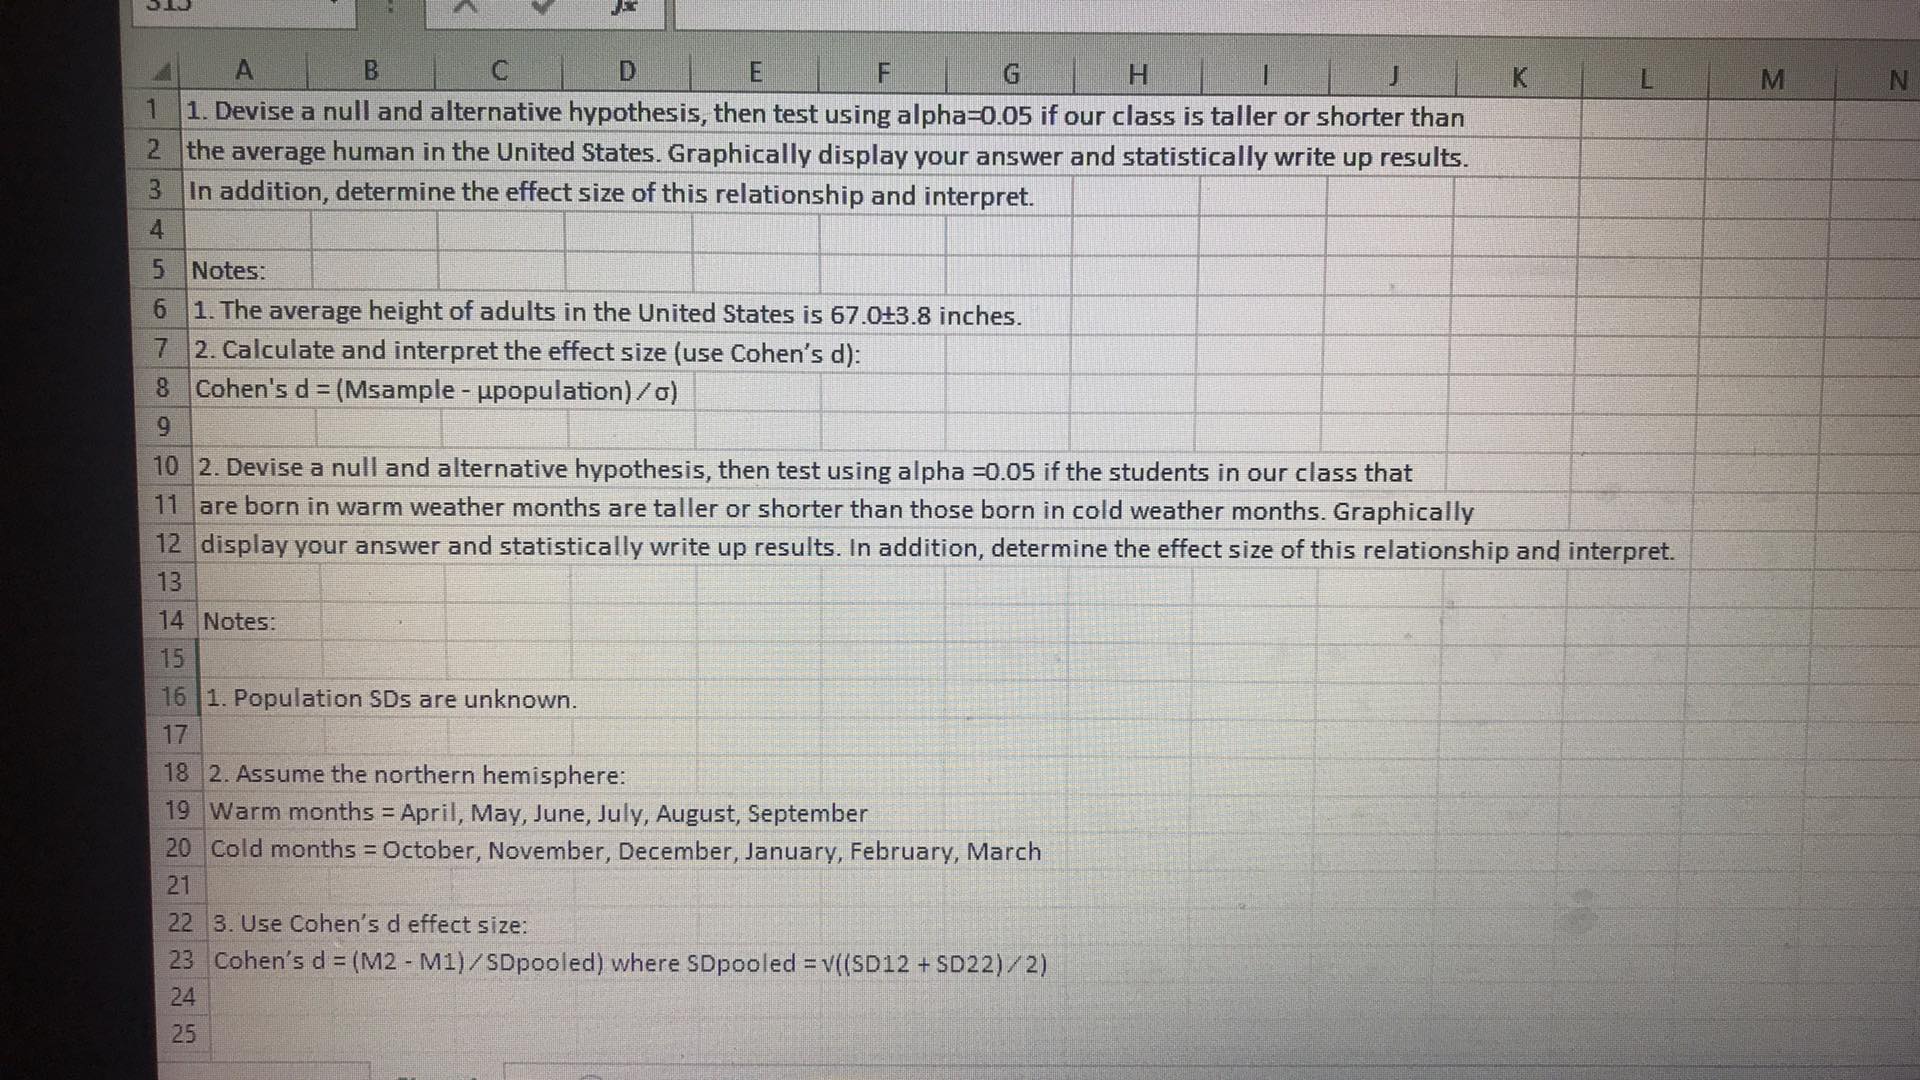
Student Data.xisx Open with A B C D E F G H Distance to School Months Birthday Work Height Foot Size (whole Hand Size (whole ID Enrolled Enrolled Month (whole (whole inches) inches) Sleep (minutes) Homework (minutes) miles) inches) 1 Arts and Scie 12 January 60 8 5 360 30 2 Applied Scie 6 February 0 62 7 6 400 45 3 Business an 8 April 5 66 10 7 420 60 4 Nursing 10 June 10 68 12 8 440 15 5 Public Servic 48 July 15 58 14 8 540 75 6 Arts and Scie 48 June 30 70 12 480 120 7 Applied Scie 36 October 32 72 11 320 80 8 Applied Scie 32 November 36 75 14 440 50 9 Applied Scie 49 March 20 68 360 60 10 Applied Scie 1 March 10 72 11 120 120 11 Applied Scie 46 March 6 74 400 70 8 70 8 60 12 Applied Scie 49 December 400 13 Business an 1 February 40 61 420 60 480 120 14 Business an 49 July 2 52 60 15 Business an 4 September 2 71 5 00 4 420 16 Applied Scie 0 69 00 - On 420 120 1 September 600 17 Arts and Scie 49 January 0 75 11 00 500 420 240 18 Applied Scie 24 September 35 60 10 5 19 Applied Scie 7 November 8 12 7 360 45 73 10 600 120 20 Applied Scie 9 January 15 67 600 45 21 Applied Scie 48 December 6 72 13 7 390 120 22 Applied Scie 36 May 6 67 10A B C D E F G H K L M N 1 1. Devise a null and alternative hypothesis, then test using alpha=0.05 if our class is taller or shorter than 2 the average human in the United States. Graphically display your answer and statistically write up results. 3 In addition, determine the effect size of this relationship and interpret. 4 5 Notes: 6 1. The average height of adults in the United States is 67.0+3.8 inches. 7 2. Calculate and interpret the effect size (use Cohen's d): 8 Cohen's d = (Msample - upopulation) / o) 9 10 2. Devise a null and alternative hypothesis, then test using alpha =0.05 if the students in our class that 11 are born in warm weather months are taller or shorter than those born in cold weather months. Graphically 12 display your answer and statistically write up results. In addition, determine the effect size of this relationship and interpret. 13 14 Notes: 15 16 1. Population SDs are unknown. 17 18 2. Assume the northern hemisphere: 19 Warm months = April, May, June, July, August, September 20 Cold months = October, November, December, January, February, March 21 22 3. Use Cohen's d effect size: 23 Cohen's d = (M2 - M1) / SDpooled) where SDpooled = V((SD12 + SD22) /2) 24 25
Step by Step Solution
There are 3 Steps involved in it

Get step-by-step solutions from verified subject matter experts