

Question: Did I get the right answer? The following table presents the scores of students in Statistics examination Scores Frequency 30 - 39 2 40 -
Did I get the right answer?
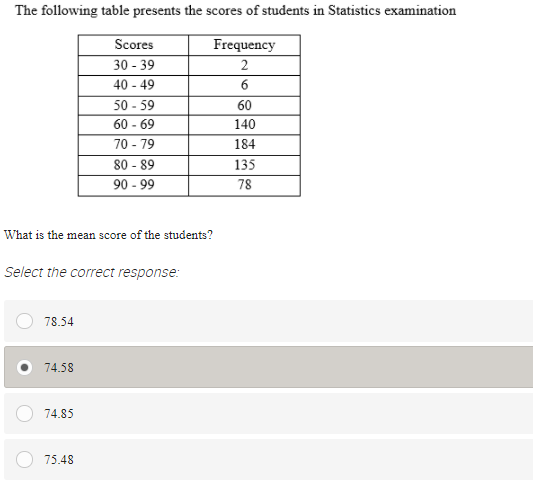
The following table presents the scores of students in Statistics examination Scores Frequency 30 - 39 2 40 - 49 6 50 -59 60 60 - 69 140 70 - 79 184 80 - 89 135 90 - 99 78 What is the mean score of the students? Select the correct response: O 78.54 O 74.58 O 74.85 O 75.48
Step by Step Solution
There are 3 Steps involved in it
1 Expert Approved Answer
Step: 1 Unlock

Question Has Been Solved by an Expert!
Get step-by-step solutions from verified subject matter experts
Step: 2 Unlock
Step: 3 Unlock