

Question: Did I solve these correctly? Predictor P Constant 0.2186 distance 7 . 332e-18 deliveries O . 3651 3 - 5,551 R-sq - 99.824 R-sq(adj) -
Did I solve these correctly?
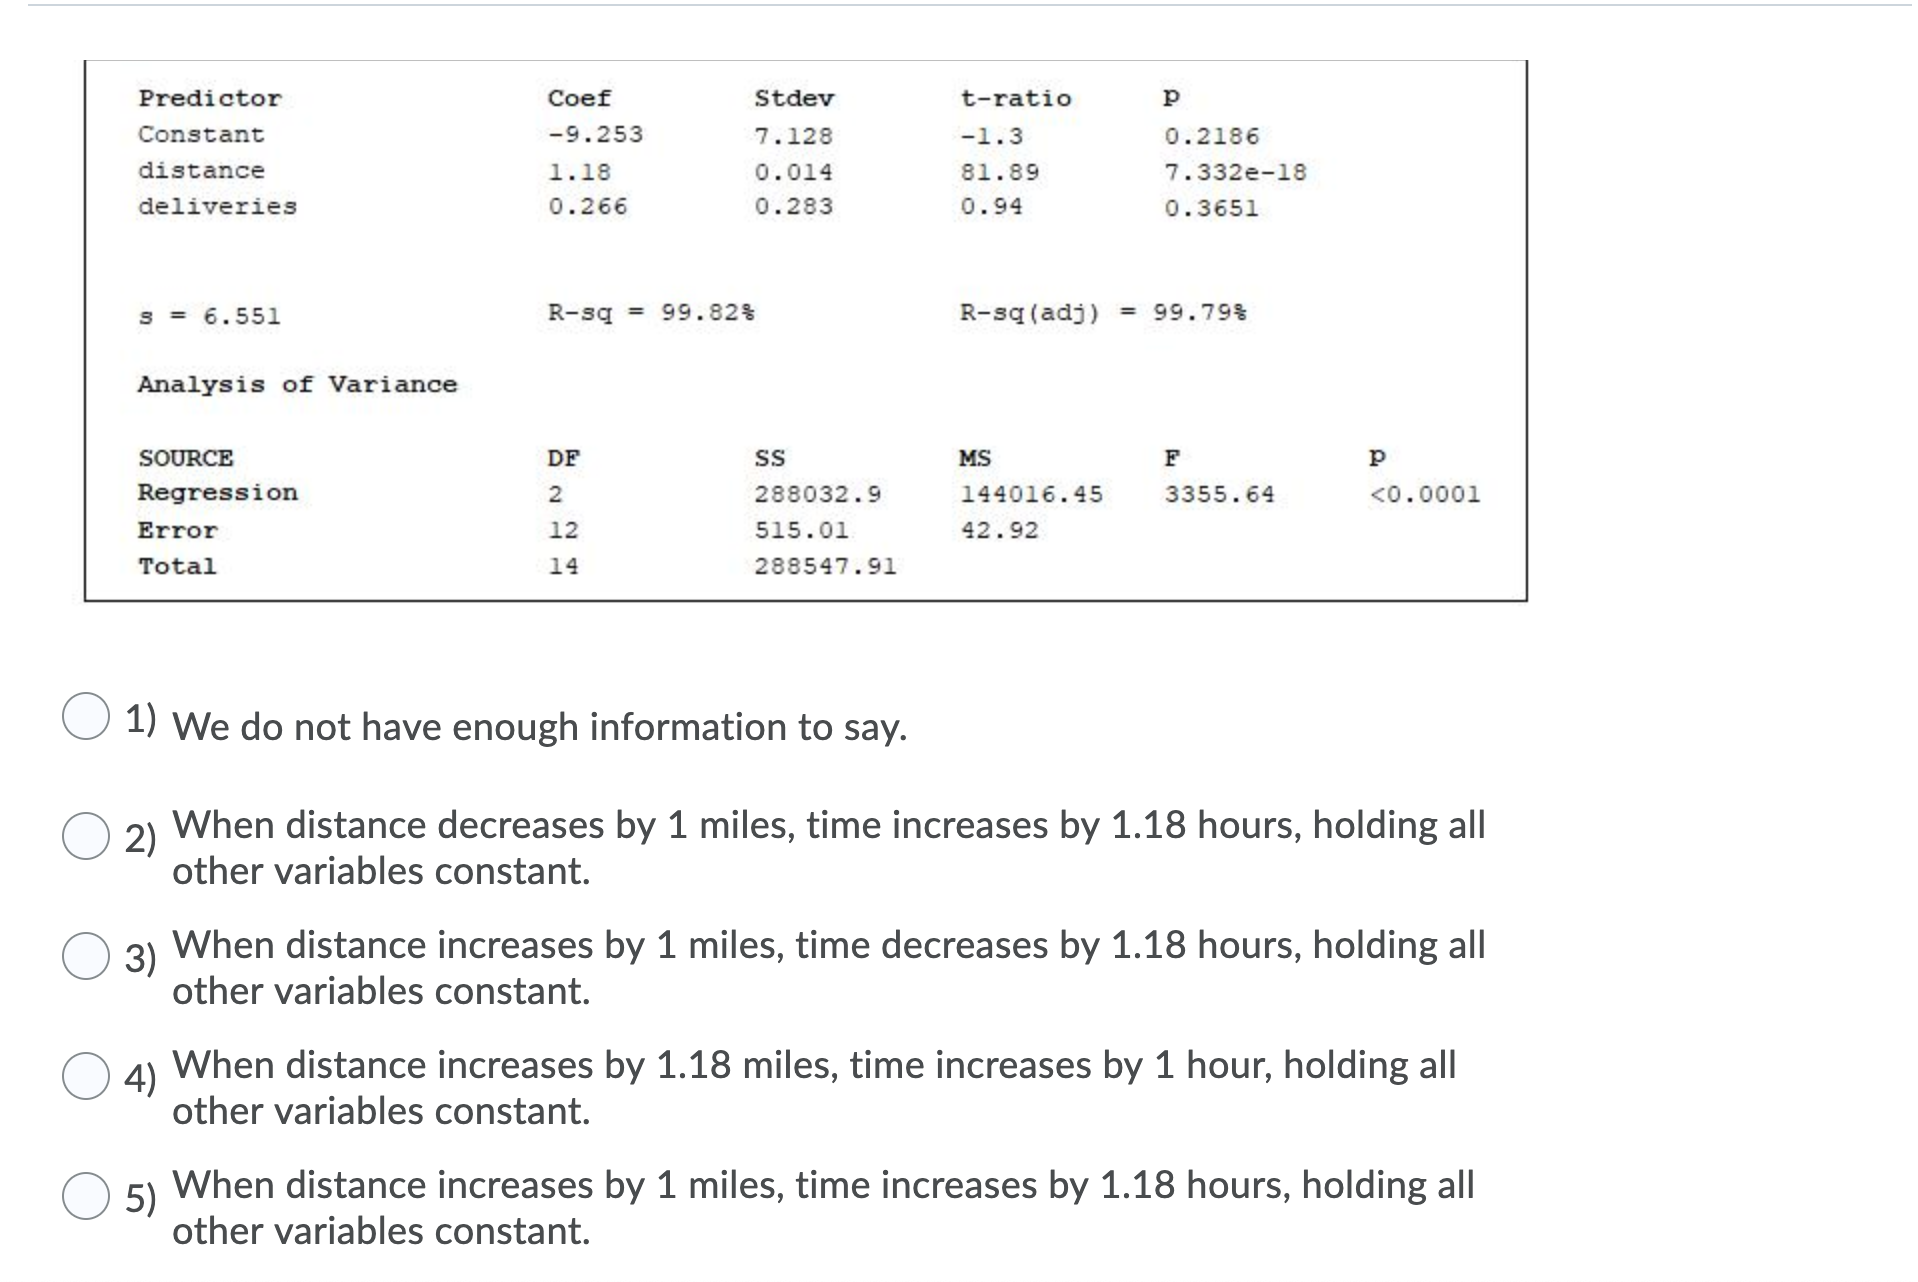
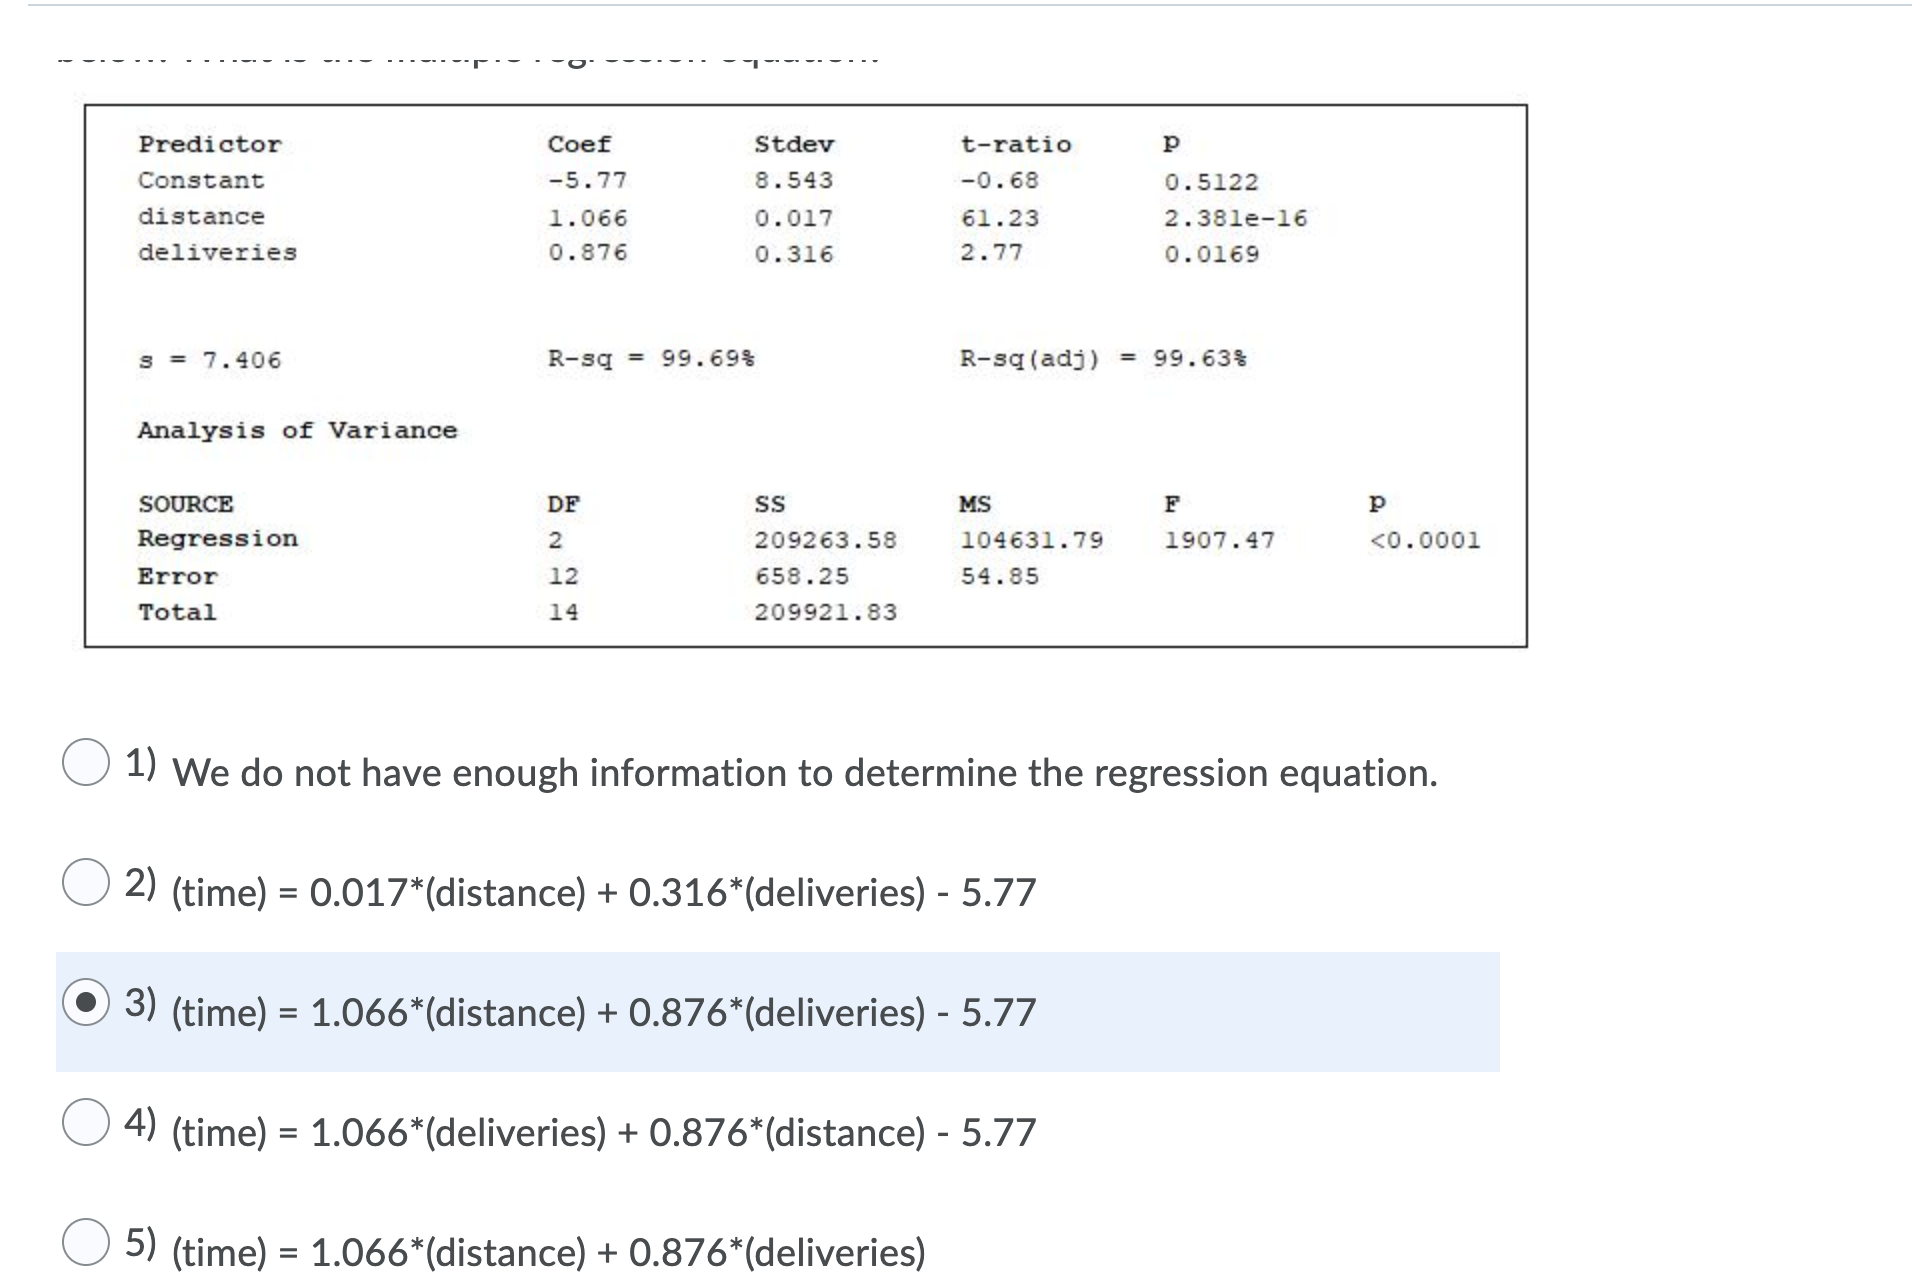
Predictor P Constant 0.2186 distance 7 . 332e-18 deliveries O . 3651 3 - 5,551 R-sq - 99.824 R-sq(adj) - 99.79% Analysis of Variance SOURCE SS HS P P Regression 288032.9 144016.45 3355.64 (0.0001 Error 515 . 01 42 . 92 Total 288547.91 O 1) We do not have enough information to say. 0 2) When distance decreases by 1 miles, time increases by 1.18 hours, holding all other variables constant. 0 3) When distance increases by 1 miles, time decreases by 1.18 hours, holding all other variables constant. 0 4) When distance increases by 1.18 miles, time increases by 1 hour, holding all other variables constant. 0 5) When distance increases by 1 miles, time increases by 1.18 hours, holding all other variables constant. Predictor Coef Stdev t-ratio P Constant -5.77 8. 543 -0. 68 0. 5122 distance 1 . 066 0. 017 61.23 2. 381e-16 deliveries 0. 876 0 . 316 2. 77 0. 0169 S = 7.406 R-sq = 99. 698 R-sq (adj ) = 99. 63: Analysis of Variance SOURCE DF SS MS F p Regression 2 209263. 58 104631. 79 1907. 47
Step by Step Solution
There are 3 Steps involved in it

Get step-by-step solutions from verified subject matter experts