

Question: Different data has been collected for the problem of Exercise 2, above (data is given in Excel file). Now we have data samples for
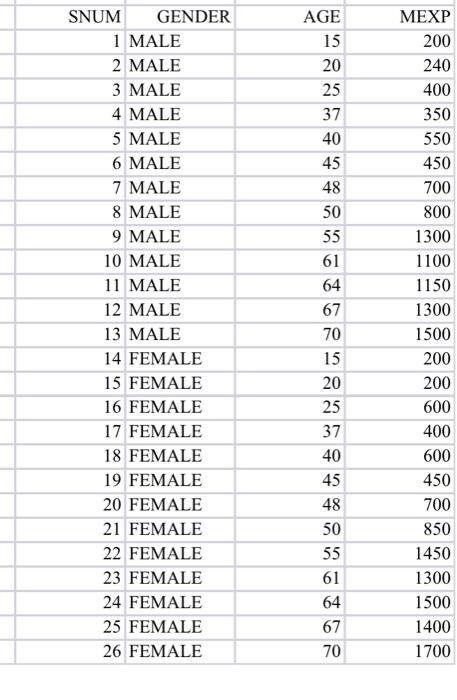
Different data has been collected for the problem of Exercise 2, above (data is given in Excel file). Now we have data samples for both genders. We shall use the Python language with the ScikitLearn library. Show snips from your notebook for the answers. NOTE: need to discover some pandas and numpy, simple functions. 1. Import the data and modify it appropriately for regression. 2. On a scatter plot, show a plot for the age against the cost. Show Male points in blue and Female points in red 3. Create the appropriate regressor with the above data. Use the default training/testing proportions. 4. Show the parameters of the regressor and the error. 5. Give the prediction for health costs for male and female at 80 years of age. SNUM GENDER 1 MALE 2 MALE 3 MALE 4 MALE 5 MALE 6 MALE 7 MALE 8 MALE 9 MALE 10 MALE 11 MALE 12 MALE 13 MALE 14 FEMALE 15 FEMALE 16 FEMALE 17 FEMALE 18 FEMALE 19 FEMALE 20 FEMALE 21 FEMALE 22 FEMALE 23 FEMALE 24 FEMALE 25 FEMALE 26 FEMALE AGE 15 20 25 37 40 45 48 50 55 61 64 67 70 15 20 25 37 40 45 48 50 55 61 64 67 70 MEXP 200 240 400 350 550 450 700 800 1300 1100 1150 1300 1500 200 200 600 400 600 450 700 850 1450 1300 1500 1400 1700
Step by Step Solution
There are 3 Steps involved in it
Based on the images provided youre being asked to perform a data analysis using Python with the ScikitLearn library as well as Pandas and NumPy librar... View full answer

Get step-by-step solutions from verified subject matter experts