

Question: Digital Image Processing: Historam equalization Write the function compute_histogram that takes a grayscale image as input and returns a length 256 vector h which is
Digital Image Processing: Historam equalization
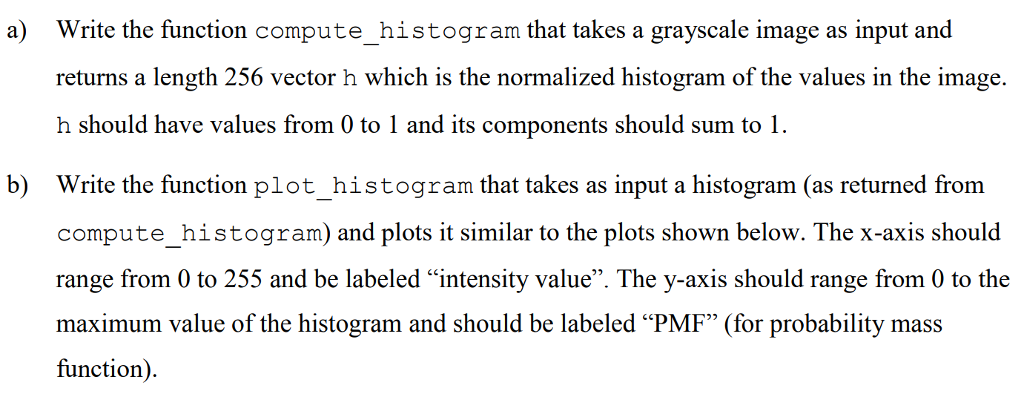

Write the function compute_histogram that takes a grayscale image as input and returns a length 256 vector h which is the normalized histogram of the values in the image. h should have values from 0 to 1 and its components should sum to Write the function plot histogram that takes as input a histogram (as returned from compute histogram) and plots it similar to the plots shown below. The x-axis should range from 0 to 255 and be labeled "intensity value". The y-axis should range from 0 to the maximum value of the histogram and should be labeled "PMF" (for probability mass function) a) b)
Step by Step Solution
There are 3 Steps involved in it
1 Expert Approved Answer
Step: 1 Unlock

Question Has Been Solved by an Expert!
Get step-by-step solutions from verified subject matter experts
Step: 2 Unlock
Step: 3 Unlock