

Question: Using part a) and b), write MATLAB code for part c) using given equation Will rate, thanks in advance. Title: Histogram Equalization In this lab,
Using part a) and b), write MATLAB code for part c) using given equation Will rate, thanks in advance.
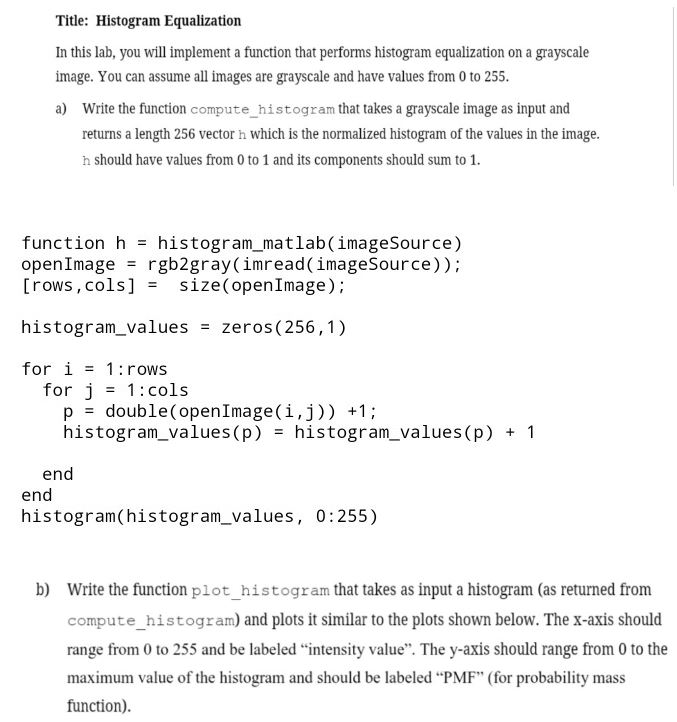
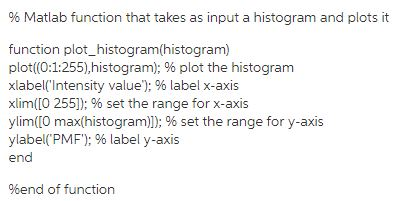
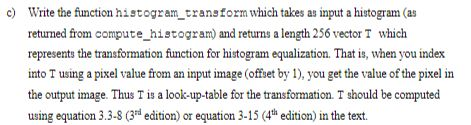
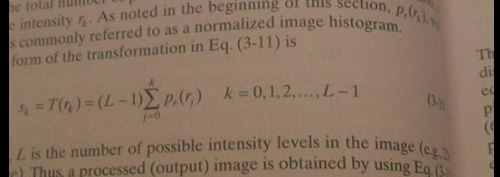
Title: Histogram Equalization In this lab, you will implement a function that performs histogram equalization on a grayscale image. You can assume all images are grayscale and have values from 0 to 255 a) Write the function compute histogram that takes a grayscale image as input and returns a length 256 vector h which is the normalized histogram of the values in the image. h should have values from 0 to 1 and its components should sum to 1. function h histogram_matlab(imageSource) open!mage = rgb2gray(imread(imageSource)); [rows,cols]size(openImage); histogram valueszeros (256,1) for i1:rows for j1:cols p double(openImage(i,j))1 histogram_values (p)histogram values (p) 1 end end histogram(histogram_values, 0:255) b) Write the function plot histogram that takes as input a histogram (as returned from compute_histogram) and plots it similar to the plots shown below. The x-axis should range from 0 to 255 and be labeled "intensity value". The y-axis should range from 0 to the maximum value of the histogram and should be labeled PMF" (for probability mass function). Title: Histogram Equalization In this lab, you will implement a function that performs histogram equalization on a grayscale image. You can assume all images are grayscale and have values from 0 to 255 a) Write the function compute histogram that takes a grayscale image as input and returns a length 256 vector h which is the normalized histogram of the values in the image. h should have values from 0 to 1 and its components should sum to 1. function h histogram_matlab(imageSource) open!mage = rgb2gray(imread(imageSource)); [rows,cols]size(openImage); histogram valueszeros (256,1) for i1:rows for j1:cols p double(openImage(i,j))1 histogram_values (p)histogram values (p) 1 end end histogram(histogram_values, 0:255) b) Write the function plot histogram that takes as input a histogram (as returned from compute_histogram) and plots it similar to the plots shown below. The x-axis should range from 0 to 255 and be labeled "intensity value". The y-axis should range from 0 to the maximum value of the histogram and should be labeled PMF" (for probability mass function)
Step by Step Solution
There are 3 Steps involved in it

Get step-by-step solutions from verified subject matter experts