

Question: Diopside flotation testwork on a laboratory scale Denver cell was completed. An empirical model representing MgO grade (y), were expressed as a function of collector
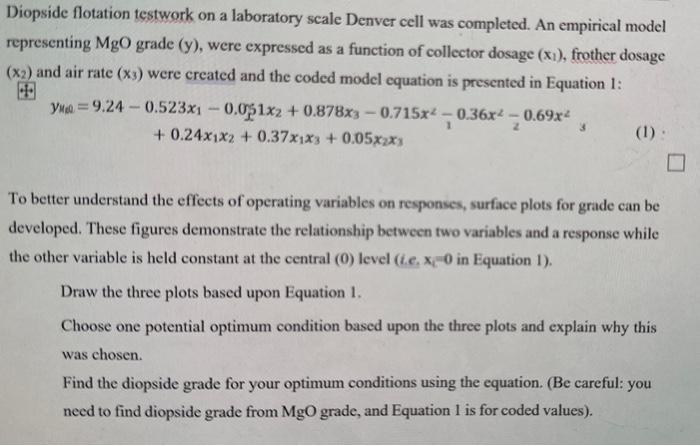
Diopside flotation testwork on a laboratory scale Denver cell was completed. An empirical model representing MgO grade (y), were expressed as a function of collector dosage (x1), frother dosage (x2) and air rate (x3) were created and the coded model equation is presented in Equation 1: yua==9.240.523x10.051x2+0.878x30.715x20.36x20.69x2+0.24x1x2+0.37x1x3+0.05x2x3 To better understand the effects of operating variables on responses, surface plots for grade can be developed. These figures demonstrate the relationship between two variables and a response while the other variable is held constant at the central (0) level (t.e, x40 in Equation 1). Draw the three plots based upon Equation 1. Choose one potential optimum condition based upon the three plots and explain why this was chosen. Find the diopside grade for your optimum conditions using the equation. (Be careful: you need to find diopside grade from MgO grade, and Equation 1 is for coded values)
Step by Step Solution
There are 3 Steps involved in it

Get step-by-step solutions from verified subject matter experts