

Question: Diopside flotation testwork on a laboratory scale Denver cell was completed. An empirical model representing MgOgrade(y), were expressed as a function of collector dosage (x1),
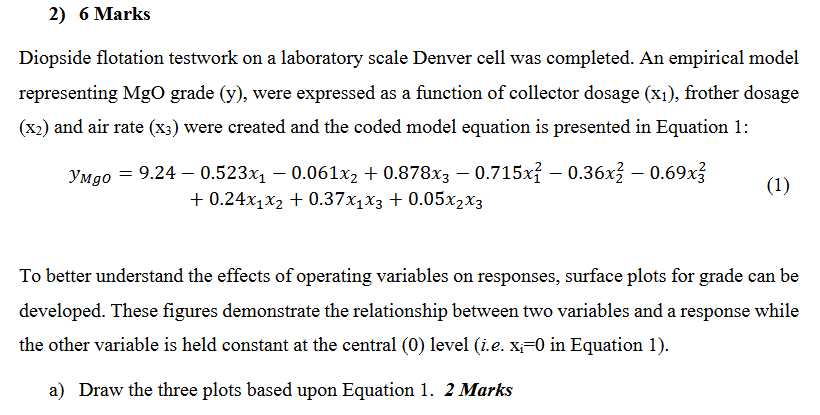
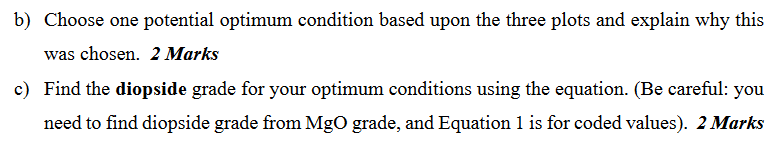
Diopside flotation testwork on a laboratory scale Denver cell was completed. An empirical model representing MgOgrade(y), were expressed as a function of collector dosage (x1), frother dosage (x2) and air rate (x3) were created and the coded model equation is presented in Equation 1: yMgO=9.240.523x10.061x2+0.878x30.715x120.36x220.69x32+0.24x1x2+0.37x1x3+0.05x2x3 To better understand the effects of operating variables on responses, surface plots for grade can be developed. These figures demonstrate the relationship between two variables and a response while the other variable is held constant at the central (0) level (i.e. xi=0 in Equation 1). a) Draw the three plots based upon Equation 1.2 Marks b) Choose one potential optimum condition based upon the three plots and explain why this was chosen. 2 Marks c) Find the diopside grade for your optimum conditions using the equation. (Be careful: you need to find diopside grade from MgO grade, and Equation 1 is for coded values). 2 Marks
Step by Step Solution
There are 3 Steps involved in it

Get step-by-step solutions from verified subject matter experts