

Question: Direction: Analyze the given data and create line graph in excel. S how step-by-step how to create line graph base on the given data to
Direction: Analyze the given data and create line graph in excel. Show step-by-step how to create line graph base on the given data to reflect the trends on population. The line graph must have the following elements: title, legend, and labels.
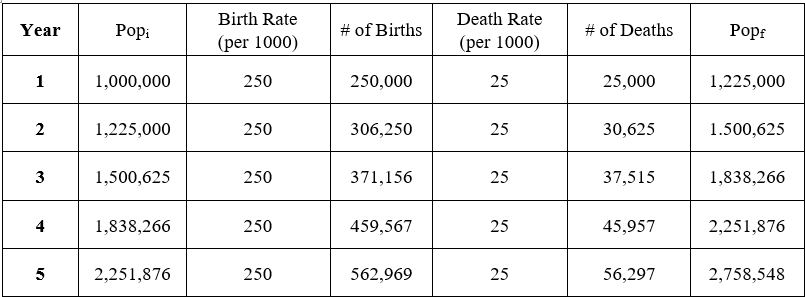
Year Birth Rate Popi # of Births Death Rate (per 1000) # of Deaths (per 1000) Popf 1 1,000,000 250 250,000 25 25,000 1,225,000 2 1,225,000 250 306,250 25 30,625 1.500,625 3 1,500,625 250 371,156 25 37,515 1,838,266 4 1,838,266 250 459,567 25 45,957 2,251.876 5 2,251,876 250 562,969 25 56,297 2,758,548
Step by Step Solution
There are 3 Steps involved in it
1 Expert Approved Answer
Step: 1 Unlock

Question Has Been Solved by an Expert!
Get step-by-step solutions from verified subject matter experts
Step: 2 Unlock
Step: 3 Unlock