

Question: Direction: Change the highlighted words and number into correct one. V. EVALUATION AND DISCUSSION Table A. Frequency Distribution Table of Average Scores Frequency Class Mark
Direction: Change the highlighted words and number into correct one.
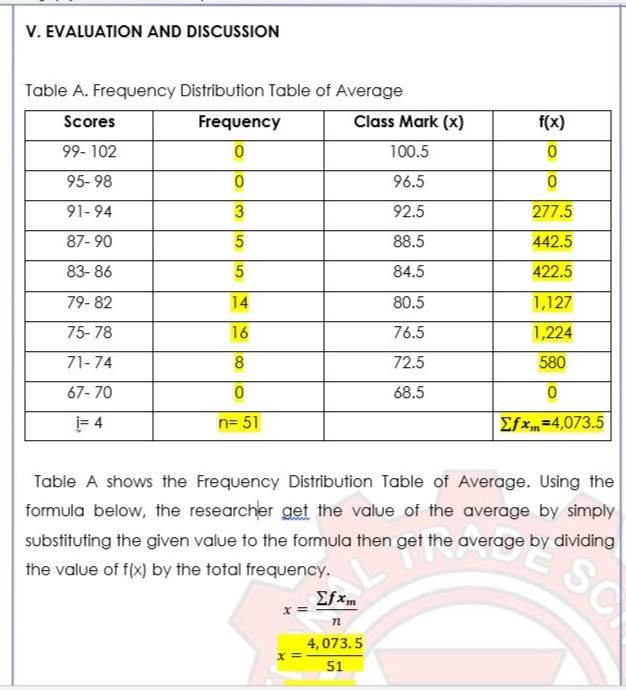
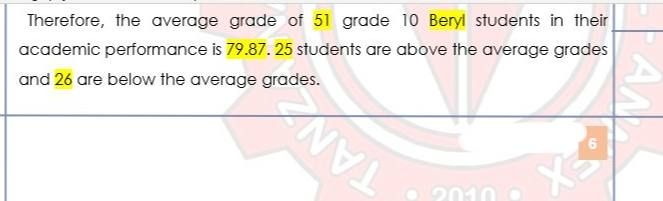
V. EVALUATION AND DISCUSSION Table A. Frequency Distribution Table of Average Scores Frequency Class Mark (x) f(x) 99- 102 0 100.5 0 95-98 O 96.5 0 91-94 92.5 277.5 87- 90 88.5 442.5 83-86 84.5 422.5 79- 82 14 80.5 1,127 75-78 16 76.5 1,224 71-74 8 72.5 580 67- 70 0 68.5 0 1= 4 n= 51 Efx, =4,073.5 Table A shows the Frequency Distribution Table of Average. Using the formula below, the researcher get the value of the average by simply substituting the given value to the formula then get the average by dividing the value of f(x) by the total frequency. S Efxm x 4, 073.5 r= 51Therefore, the average grade of 51 grade 10 Beryl students in their academic performance is 79.87. 25 students are above the average grades and 26 are below the average grades. TAN 6 9010
Step by Step Solution
There are 3 Steps involved in it

Get step-by-step solutions from verified subject matter experts